
Most small business owners make decisions the same way: gut feeling, past experience, and a little prayer. And honestly, that gets you pretty far. But at some point, running on instinct alone starts costing you money. The good news is you don’t need a data science degree or a team of analysts to make smarter calls. You just need to know which numbers to pay attention to and what to do with them.
This guide breaks down how small business owners can use data practically, without drowning in spreadsheets or hiring a full-time analyst.
Why Data-Driven Decisions Beat Gut Decisions
Your gut is trained on your own experience. That’s valuable, but it has blind spots. You might love a product that barely sells. You might keep a service priced too low because it feels good to offer it. You might ignore your best traffic channel because you assume it’s too competitive.
Data doesn’t have opinions. It shows you what’s actually happening: what customers are buying, when they’re buying it, where they’re coming from, and where you’re losing them. When you combine that with your experience and instincts, you make better decisions faster.
The goal isn’t to replace your judgment. It’s to give your judgment better information to work with.
Start With the Data You Already Have
You don’t need to buy expensive software or build a data warehouse. Most small businesses are already sitting on more useful data than they realize. Here’s where to look first:
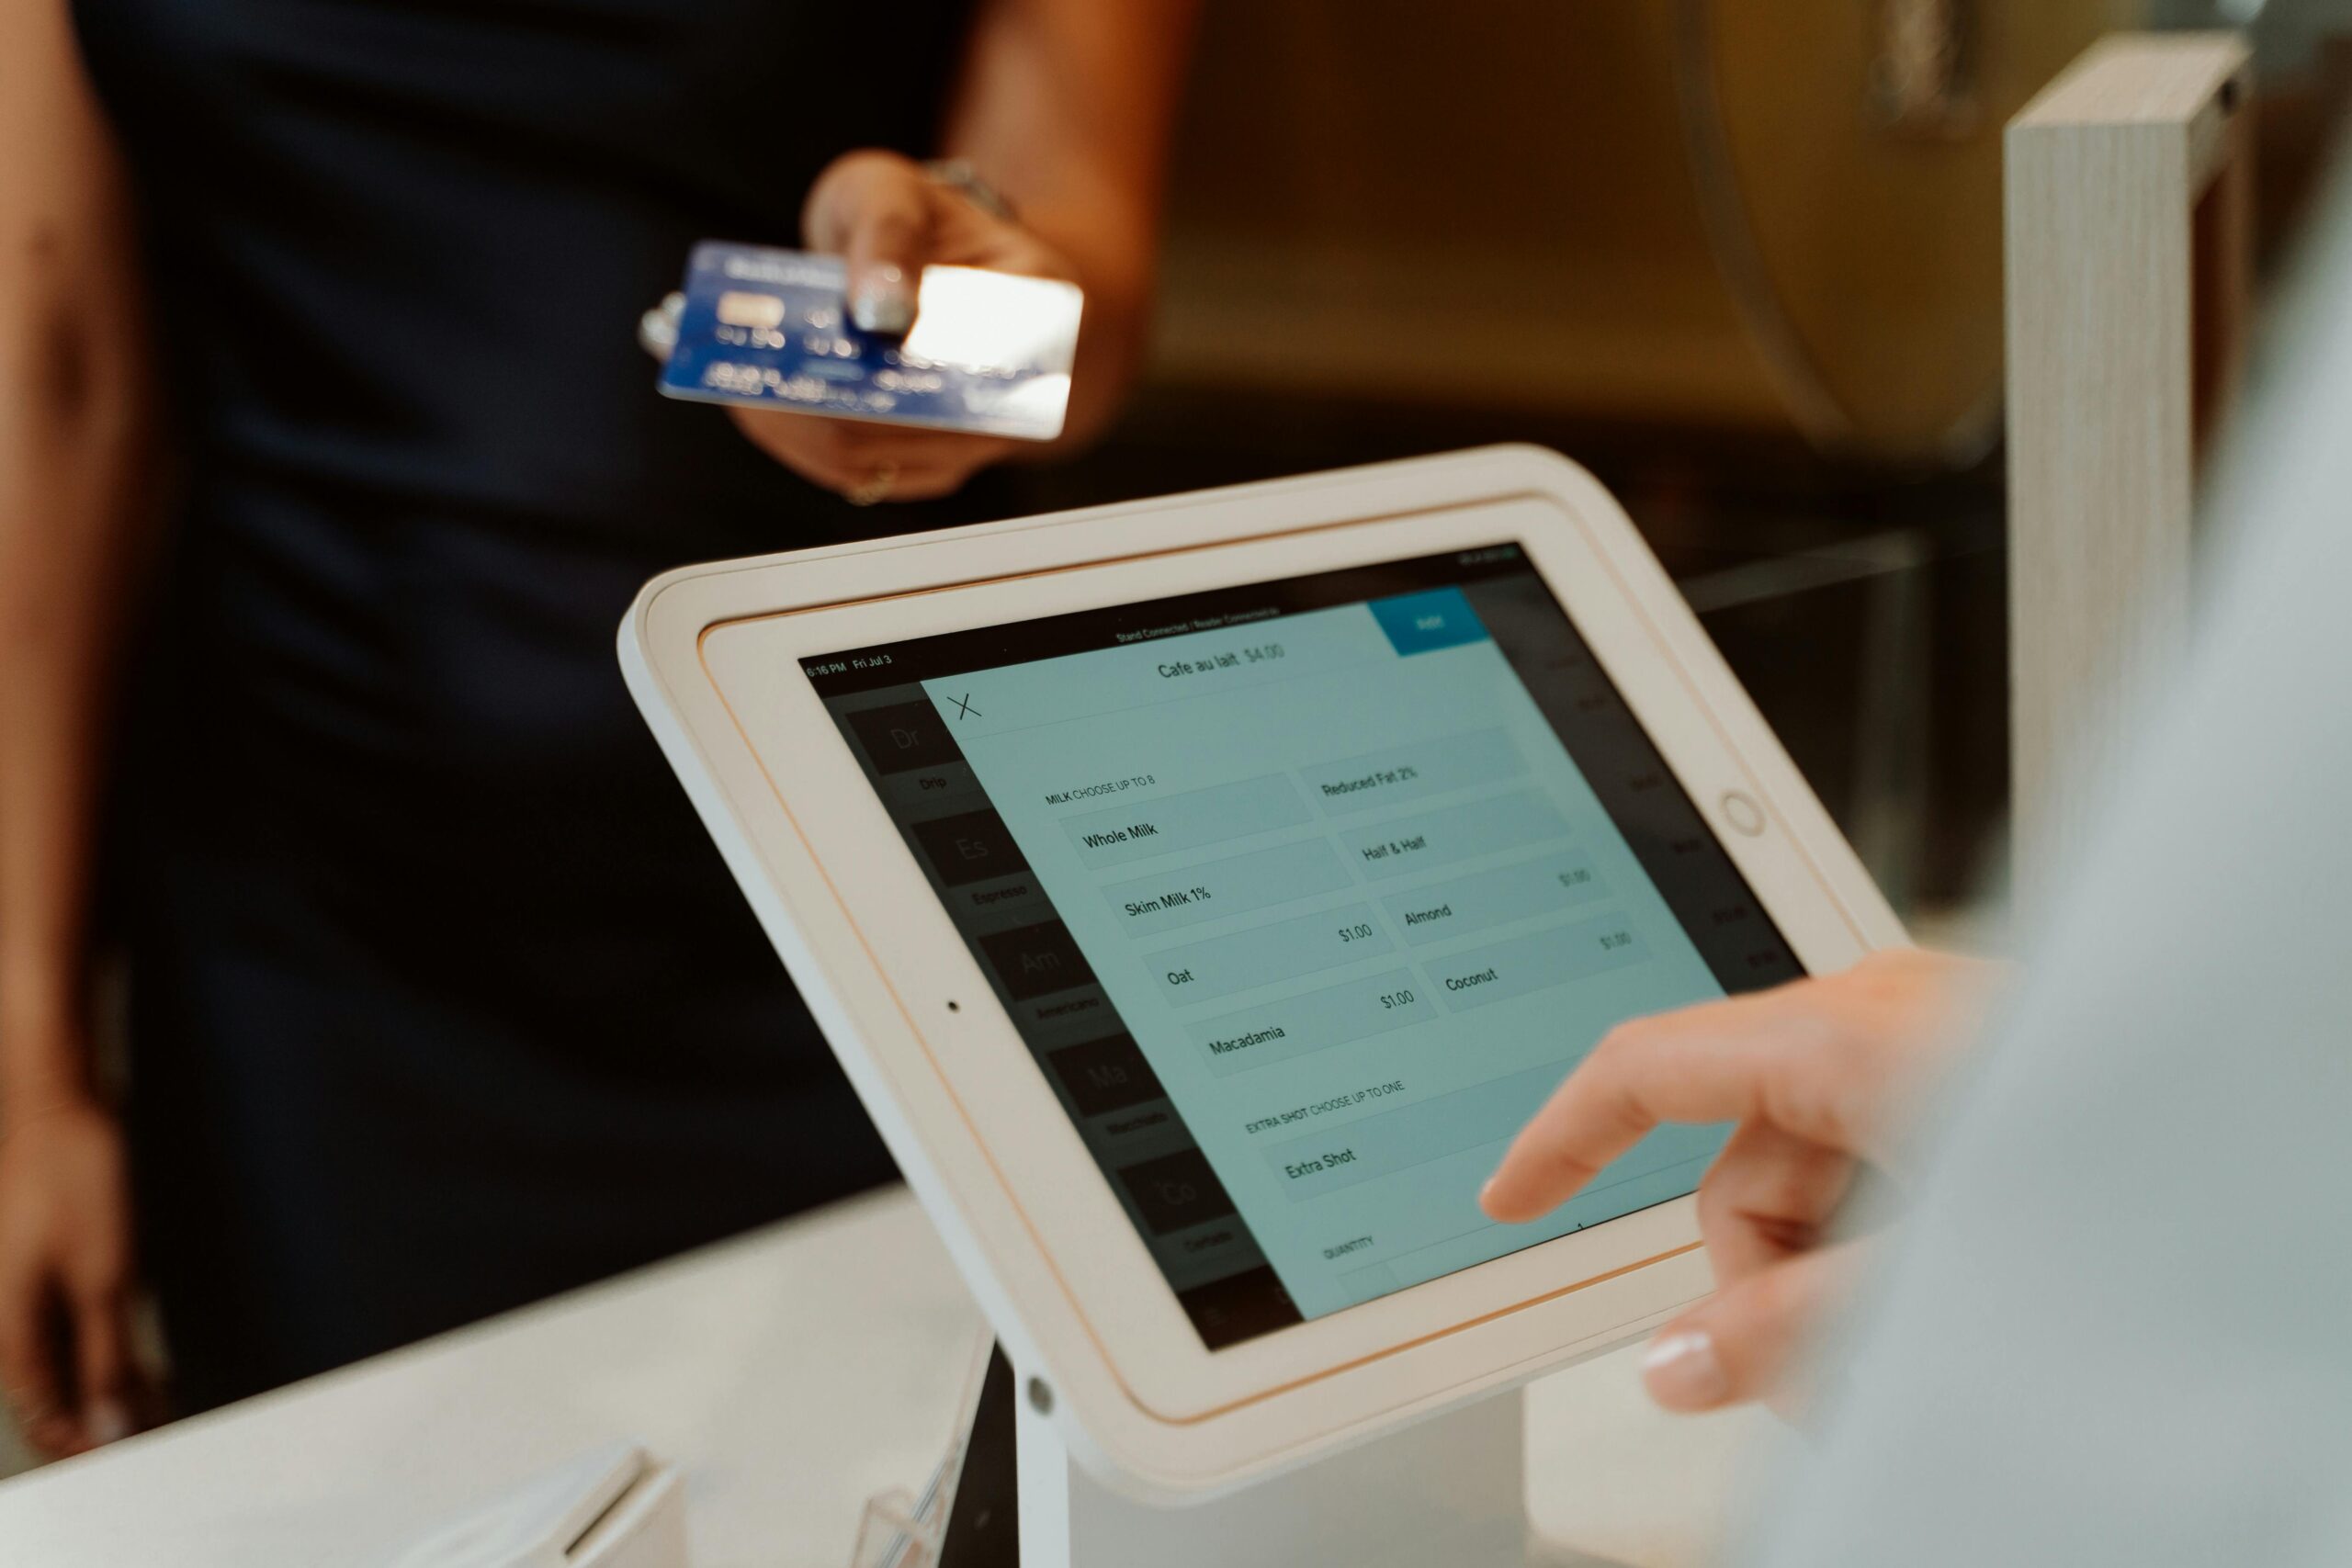
Your Point-of-Sale or Payment System
If you use Square, Stripe, or any modern POS system, you have a goldmine. Look at: which products or services generate the most revenue, your average transaction size, your busiest days and hours, and repeat purchase rates. This tells you where to focus your energy and where you might be wasting it.
Your Website Analytics
Google Analytics (it’s free) shows you how people find your website, which pages they visit, and where they leave. If 80% of your visitors are bouncing from your pricing page, that’s a signal. If one blog post drives most of your traffic, that’s a signal too. Check out our guide to Google Analytics for small business owners if you want a plain-English breakdown of what to look at.
Your CRM or Customer Records
Even a simple spreadsheet with customer names, purchase dates, and amounts tells a story. Who are your top 20% of customers by spend? How often do they come back? Do certain types of customers churn faster than others? A proper CRM tool makes this analysis automatic, but even manual tracking beats flying blind.
The Five Numbers Every Small Business Owner Should Track
You can’t track everything. And you shouldn’t try. Here are the five metrics that give most small business owners the clearest picture:
1. Customer Acquisition Cost (CAC)
How much does it cost you to get one new customer? Divide your total sales and marketing spend in a given period by the number of new customers you acquired. If you spent $1,000 on ads last month and got 20 new customers, your CAC is $50. Now ask yourself: is the average customer worth more than $50 to you? If yes, you’re in good shape. If not, something needs to change.
2. Customer Lifetime Value (LTV)
This is the average total revenue a customer brings in over their relationship with your business. Multiply average purchase value by purchase frequency by average customer lifespan. A customer who buys $100 from you twice a year for three years is worth $600. Knowing your LTV helps you decide how much you can afford to spend acquiring customers and where retention efforts pay off most.
3. Gross Margin
Revenue minus the direct cost of goods or services delivered, divided by revenue. This tells you what percentage of each sale you actually keep before overhead. A business with 60% gross margins has much more room to grow profitably than one operating at 20%. If your margins are tight, either your pricing is too low or your costs are too high.
4. Conversion Rate
Of everyone who hears about your business or visits your website, what percentage actually buys? This applies everywhere: website visitors to leads, leads to customers, proposals to closed deals. Low conversion rates are usually a pricing, messaging, or trust problem. Tracking where leads drop off tells you exactly where to fix things.
5. Month-Over-Month Revenue Trend
Are you growing, flat, or shrinking? Simple as it sounds, many business owners don’t track this consistently. A 30-day snapshot doesn’t tell you much. A 12-month trend tells you everything. It shows seasonality, whether your efforts are working, and gives you early warning signals when things start to slip.
How to Actually Use This Data Day-to-Day
Collecting data is pointless if it just sits in a dashboard no one looks at. Here’s how to build simple habits that turn numbers into decisions:
Do a Weekly 15-Minute Review
Pick the same day every week, pull up your top three or four metrics, and ask one question: is anything moving in the wrong direction? That’s it. You’re not running a quarterly business review. You’re doing a pulse check. Spot problems early enough and they’re cheap to fix. Spot them late and they’re expensive.
Let Data Drive One Decision a Month
You don’t have to overhaul your whole operation. Just commit to letting the data drive one business decision per month. Noticed your Tuesday revenue is half what Wednesday brings in? Try running a Tuesday special and see if it moves the needle. One data-backed test per month compounds into real improvements over time.
Compare Yourself Against Yourself, Not Others
Industry benchmarks are useful context, but your most important competitor is the version of your business from 90 days ago. Are you improving? That’s the real question. Benchmarks shift, industries vary, and your market is unique. Use your own historical data as the baseline.
Tools That Make Data Accessible for Non-Tech Owners
You don’t need enterprise software. Here are tools small business owners actually use:
- Google Analytics 4 (free) for website data
- Google Looker Studio (free) to build simple dashboards pulling from multiple sources
- Square or Stripe dashboards for sales and payment trends
- HubSpot CRM (free tier) for customer and lead tracking
- Google Sheets with a simple monthly tracking tab if you’re just starting out
The best tool is the one you’ll actually open. Start simple and upgrade when you outgrow it.
Common Mistakes Small Business Owners Make With Data
A few traps to avoid as you get started:
Tracking too many things. Five clear metrics beat twenty confusing ones. Start narrow.
Reacting to one bad week. Short-term noise is everywhere. Give any trend at least 30 days before you make a major change based on it.
Ignoring qualitative feedback. Data tells you what is happening, but it doesn’t always tell you why. Pair your numbers with customer conversations and reviews to get the full picture. Doing a competitive analysis alongside your internal data can also reveal gaps you’d never find looking inward alone.
Analysis paralysis. Some owners collect data endlessly and never act on it. Data is meant to drive decisions. Make a call, test it, measure the result, adjust. That loop is where the real value lives.
The SBA’s Take on Small Business Analytics
The U.S. Small Business Administration emphasizes that small businesses leveraging data analytics are better positioned to identify growth opportunities, manage costs, and respond to market shifts faster than those operating on intuition alone. The barrier to entry has never been lower, and the competitive advantage for those who act on data has never been higher.
Start Small, Stay Consistent
You don’t need to become a data scientist. You need to become someone who looks at the right numbers consistently and lets them inform what you do next. Pick two or three metrics from this list, start tracking them weekly, and build the habit. That alone puts you ahead of most small business owners who are still running entirely on instinct.
Once you trust the process, you’ll wonder how you ever made decisions without it.
Want more practical strategies like this? Join Hustler’s Library for free and get tools, guides, and resources built for entrepreneurs who want to grow smarter, not just harder.
Ready to Know Where You Stand?
The Business Journey dashboard maps your exact position across all 13 stages. Track your progress, unlock resources for each step, and build with a framework used by thousands of founders at Hustler's Library.
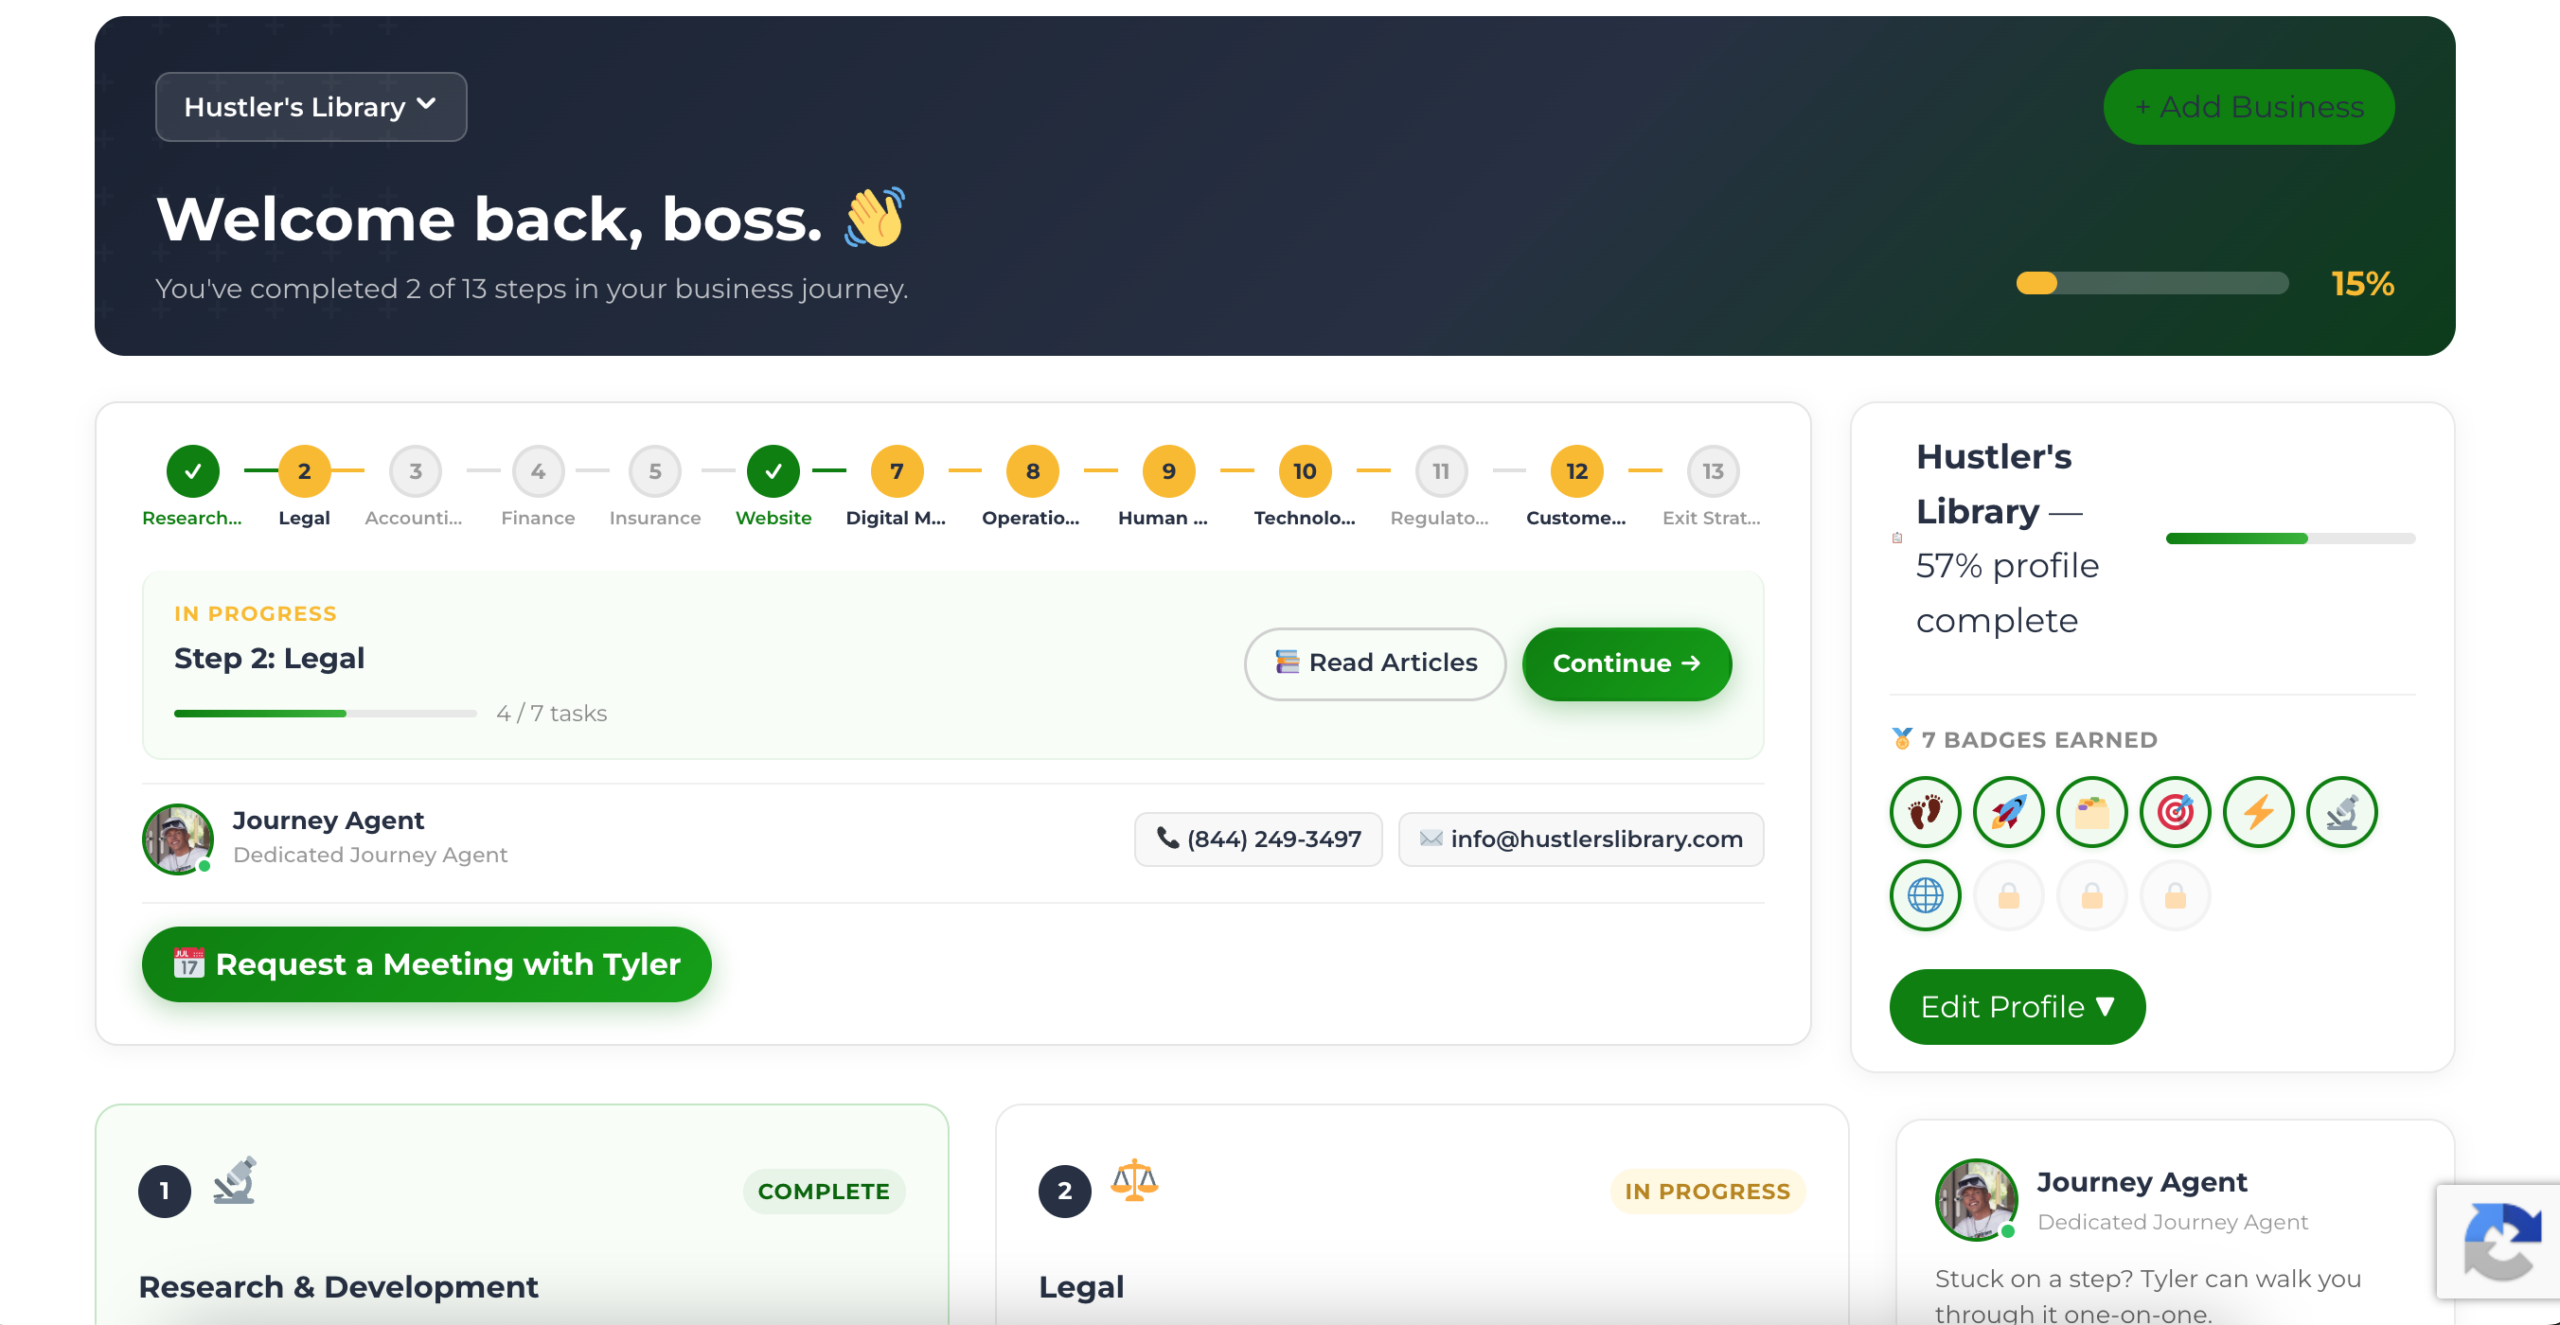
No credit card required · Takes 3 minutes · Personalized to your stage