

Most small business owners are busy. Incredibly busy. They’re juggling sales calls, managing employees, handling customer complaints, and trying to find ten minutes to eat lunch. But here’s the hard truth: being busy is not the same as moving forward. Without the right numbers in front of you, you’re flying blind.
That’s where Key Performance Indicators come in. KPIs are the handful of numbers that actually tell you whether your business is healthy, growing, or quietly bleeding out. When you know your KPIs, you stop reacting and start steering. This guide will show you exactly how to choose, track, and act on them, no MBA required.
What Is a KPI, Really?
A Key Performance Indicator is a measurable value that shows how effectively your business is achieving a specific goal. That sounds fancy, but it’s simple: a KPI is a number you watch because it tells you something important.
Revenue is a KPI. So is customer acquisition cost, average order value, employee turnover rate, and the percentage of invoices paid on time. The word “key” is doing a lot of work here. Not every number is a KPI. Your KPIs are the ones that, if they changed dramatically, would change how you run your business.
The mistake most small business owners make is tracking too many numbers or none at all. They either drown in spreadsheets or rely entirely on gut feel. Neither works. The goal is a small, focused set of indicators that give you a clear picture without overwhelming you.
The Four Categories of Small Business KPIs
To keep things practical, think of your KPIs in four buckets:
1. Financial KPIs
These tell you whether you’re making money and whether you’ll keep making money. Key ones for small business owners include:
- Monthly revenue — total income before expenses
- Gross profit margin — revenue minus cost of goods sold, expressed as a percentage
- Net profit margin — what you actually keep after all expenses
- Accounts receivable aging — how long it takes customers to pay you
You don’t need fancy software to track these. A simple spreadsheet updated weekly does the job.
2. Customer KPIs
These tell you how well you’re attracting and keeping the people who pay your bills:
- Customer acquisition cost (CAC) — how much you spend to win one new customer
- Customer retention rate — what percentage of customers come back
- Net Promoter Score (NPS) — a simple survey metric that measures whether customers would recommend you
- Average transaction value — how much the average customer spends per visit or purchase
3. Operations KPIs
These show whether your business is running efficiently behind the scenes:
- Order fulfillment time — how long it takes to deliver a product or complete a service
- Employee productivity — revenue or output per employee
- Error or defect rate — how often things go wrong that you have to fix
- On-time delivery rate — the percentage of jobs completed by the promised deadline
4. Growth KPIs
These tell you whether your business is expanding or stagnating:
- Month-over-month revenue growth
- New customer count per month
- Website traffic and lead volume (if applicable)
- Repeat purchase rate
You don’t need to track all of these at once. Start with two or three from each category and build from there.
How to Choose the Right KPIs for Your Business
Here’s the truth: the right KPIs for your business depend entirely on what stage you’re in and what problem you’re trying to solve.
If you’re a new business trying to get traction, your most important KPIs are probably new customer count, conversion rate, and customer acquisition cost. If you’re an established business trying to grow, you’ll care more about retention rate, average order value, and gross margin. If you’re in survival mode, your top priority is probably accounts receivable aging and net margin.
A good rule of thumb: pick no more than five to seven KPIs to track at any one time. If you try to track everything, you’ll end up focused on nothing. Before adding a KPI to your list, ask yourself: if this number went up or down by 20 percent, would I change what I’m doing? If the answer is no, it’s not a key indicator. It’s just a number.
It also helps to connect your KPIs to your current goals. If your goal for the quarter is to improve customer retention, then your KPIs should include retention rate, repeat purchase rate, and possibly NPS. Your scoreboard should reflect the game you’re actually playing right now.
Building a Simple KPI Tracking System
You don’t need expensive software to track KPIs. A simple weekly rhythm is more valuable than a fancy dashboard you never open. Here’s how to set one up:
Step 1: Choose your KPIs. Pick five to seven based on your current business goals. Write them down.
Step 2: Identify your data source. For each KPI, know exactly where the number comes from. Revenue from your accounting software. Customer count from your POS or CRM. NPS from a monthly email survey.
Step 3: Set a baseline. Before you can measure progress, you need to know where you’re starting. Pull your last 90 days of data for each KPI and calculate your current average.
Step 4: Set a target. For each KPI, decide what “good” looks like. This doesn’t have to be perfect. It just needs to be directional. If your gross margin is currently 38 percent, maybe your target is 42 percent by end of quarter.
Step 5: Review weekly. Block 30 minutes every week, ideally the same time every week, to update your numbers and ask: what changed, why did it change, and what do I need to do about it? This weekly review is where the real value happens.
The SBA has solid resources on managing your business finances that pair well with a KPI tracking practice.
Common KPI Mistakes Small Business Owners Make
Tracking vanity metrics. Social media followers and website page views feel good to watch, but they often have no direct link to revenue. Focus on numbers that connect to money or growth.
Setting targets without context. A 10 percent month-over-month growth target sounds great, but is it realistic for your industry and season? Research benchmarks for your type of business so your targets are grounded in reality.
Reviewing KPIs too infrequently. Monthly reviews are better than nothing, but weekly is the sweet spot. Businesses move fast. If you only check your numbers once a month, you’ll often be reacting to problems that have been brewing for weeks.
Ignoring leading indicators. Lagging indicators like monthly revenue tell you what happened. Leading indicators like number of sales calls made or proposals sent tell you what’s about to happen. The best KPI systems include both. If your sales pipeline is thin this month, next month’s revenue will likely show it.
Not sharing KPIs with your team. If you have employees, sharing relevant KPIs creates accountability and alignment. People work harder and smarter when they can see the scoreboard. You don’t need to share everything, but consider sharing the numbers that your team can directly influence.
Connecting KPIs to Decisions
Tracking KPIs is pointless if you never act on what they tell you. The whole point of measuring is to make better decisions, faster. Once your system is in place, your weekly review should end with one question: what’s the one thing I should do differently this week based on what I see?
If your customer acquisition cost is rising, maybe it’s time to test a new referral channel or tighten your ad targeting. If your average order value is dropping, maybe it’s time to introduce a bundle or premium tier. If your on-time delivery rate is slipping, maybe you need to add a step to your operations checklist or hire additional help.
KPIs don’t make decisions for you. They give you the information you need to make better ones. And the more consistently you review them, the faster you’ll start to see patterns that let you get ahead of problems instead of chasing them.
If you want to take your decision-making a step further, check out our guide on how to use data to make better business decisions, which digs into the analytical mindset behind smart business choices.
When to Change Your KPIs
Your KPIs should evolve as your business evolves. The numbers that matter in year one are not the same ones that matter in year five. Review your KPI list at least once per quarter and ask: are these still the right scoreboard for where we’re trying to go?
When you hit a target consistently, either raise the target or replace the KPI with something that challenges you more. When a KPI stops producing useful information, retire it. And when your business enters a new phase, like launching a new product line, hiring your first manager, or entering a new market, update your KPIs to reflect that new reality.
This pairs naturally with the habit of doing regular business health checks. If you haven’t already, read our guide on how to conduct a small business health check to get a full picture of where your business stands beyond the numbers.
Final Thoughts
You don’t need to be a data scientist to run a data-driven business. You just need to pick a small set of meaningful numbers, track them consistently, and use them to guide your weekly decisions. Most small business owners who start doing this are surprised by how quickly it changes the way they operate.
You stop guessing. You stop making the same mistakes. You start seeing problems early enough to fix them and opportunities early enough to act on them. That’s the real power of KPIs: not the spreadsheet itself, but the clarity it gives you.
Ready to build a smarter, more focused business? Join Hustler’s Library for free and get the tools, templates, and resources to put your numbers to work.
Ready to Know Where You Stand?
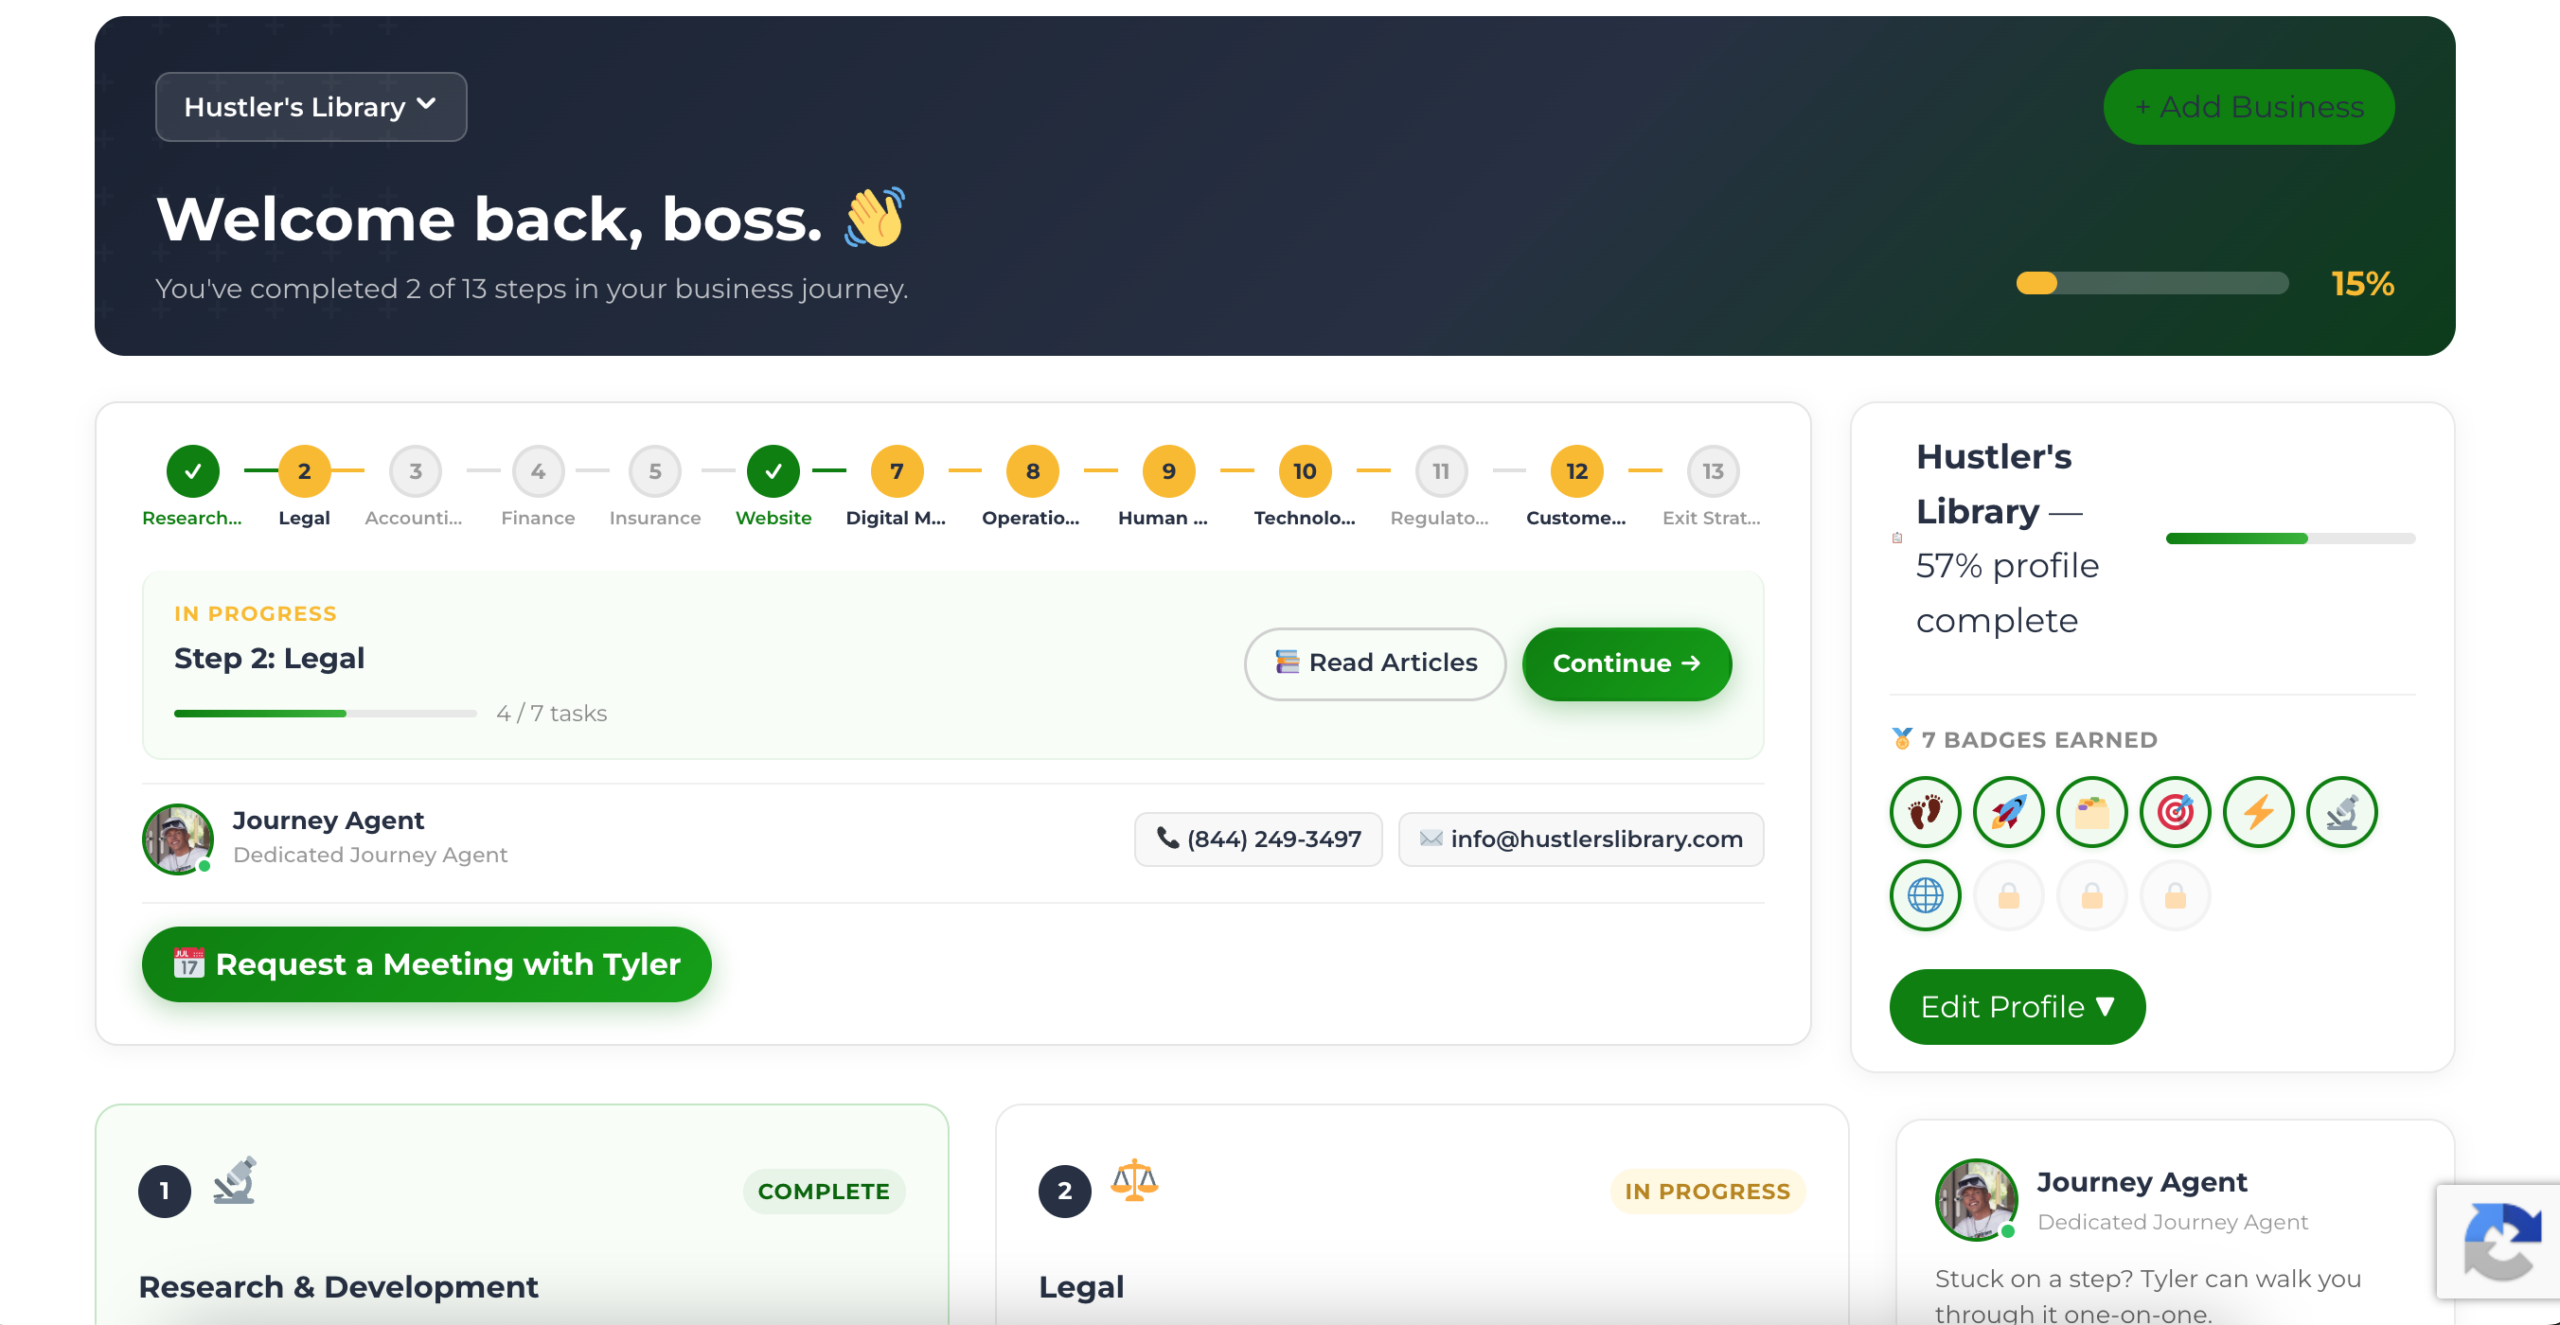
The Business Journey dashboard maps your exact position across all 13 stages. Track your progress, unlock resources for each step, and build with a framework used by thousands of founders at Hustler's Library.
No credit card required · Takes 3 minutes · Personalized to your stage