
Most small business owners make decisions the same way they always have: gut instinct, habit, and whatever their most vocal customer said last week. That works sometimes. But it also keeps you running in circles, spending money on things that feel right but don’t move the needle, and missing problems until they become crises.
A data-driven culture doesn’t mean turning your business into a spreadsheet factory. It means making decisions with evidence instead of assumptions. It means asking “what do the numbers say?” before committing to something new. And it means building habits and systems so your whole team is doing the same.
Here’s how to actually do it, even if you’re starting from scratch.
Why Most Small Businesses Ignore Data (And Why That’s Costing You)
The biggest reason small business owners don’t use data isn’t laziness. It’s that nobody ever showed them how to connect the numbers to the decisions that actually matter. So they collect data they never look at, look at numbers they don’t understand, or look at the wrong metrics entirely.
The cost is real. According to research from McKinsey, data-driven organizations are 23 times more likely to acquire customers, six times as likely to retain them, and 19 times as likely to be profitable. Those aren’t big-company numbers. That’s the difference between guessing and knowing.
The good news: you don’t need a data science team to build this kind of culture. You need clarity, consistency, and the right few metrics to track.
Step 1: Define What “Good” Looks Like for Your Business
Before you can use data, you need to know what you’re measuring and why. The most common mistake is tracking everything and acting on nothing. Instead, identify the three to five numbers that most directly reflect the health of your business.
For a service business, that might be: monthly revenue, average project value, client retention rate, new leads per week, and conversion rate from inquiry to signed contract. For a product business, it might be units sold, return rate, average order value, cost per acquisition, and inventory turnover.
These are your core metrics. Write them down. Define exactly how you calculate each one. And then set a baseline by pulling your current numbers. You can’t improve what you haven’t measured.
If you haven’t done this yet, the guide on how to use key performance indicators to run a smarter small business is a solid starting point for identifying which numbers matter most for your specific type of operation.
Step 2: Build a Simple Reporting Rhythm
Data only changes behavior when it gets reviewed consistently. That means building a cadence that fits how your business actually runs.
A basic rhythm for most small businesses looks like this:
- Daily: Revenue, new orders, or inquiries. Just a quick glance to stay oriented.
- Weekly: Sales pipeline, team output, and any operational flags. Review during your weekly team meeting or solo review session.
- Monthly: Full financial review, customer metrics, and trend analysis. Compare against prior months and your targets.
- Quarterly: Strategic review. Are you hitting your goals? What’s working, what isn’t, and what do you need to change?
You don’t need fancy software to do this. A well-structured Google Sheet reviewed on a consistent schedule beats an expensive dashboard that nobody opens. The point is frequency and follow-through.
Step 3: Get Your Team Involved
A data-driven culture isn’t just about the owner having access to numbers. It means your team understands what the numbers are, what they mean, and how their work connects to them.
Start by sharing your core metrics with your team in your weekly or monthly review. Not to pressure anyone, but to create shared context. When your customer service rep knows that customer retention is at 72% and the goal is 80%, their daily interactions carry more meaning. When your sales person sees conversion rate trending up, they get feedback that their process is working.
The more your team sees the business through the lens of numbers, the more decisions they’ll make independently that align with where you’re trying to go. This also builds accountability without micromanagement because the data speaks for itself.
Make Data Part of Your Decision Language
Encourage your team (and yourself) to answer questions with data, not just opinions. When someone proposes a new marketing channel, ask: “What does our current conversion data say about where our best customers come from?” When you’re considering a price change, ask: “What’s our current margin, and what would this change do to it?”
This isn’t about being cold or robotic. It’s about adding rigor to decisions that are currently based on nothing more than a hunch. Hunches can be right. But hunches plus data are better.
Step 4: Choose the Right Tools (Without Overcomplicating It)
You don’t need enterprise software to run a data-driven business. But you do need tools that make it easy to collect, visualize, and act on your numbers.
Here’s a lean stack that works for most small businesses:
- Accounting software (QuickBooks, FreshBooks, or Wave): Your financial data lives here. Revenue, expenses, profit, accounts receivable.
- Google Analytics or similar: Website traffic, conversion rates, and where your leads are coming from.
- CRM: Sales pipeline, customer history, and conversion data. Even a basic free CRM is far better than notes in your head.
- Google Sheets or Airtable: A central place to compile your core metrics and track trends over time.
The key is integration. If you can connect your accounting software and CRM to a central dashboard, you eliminate the manual work of pulling data and dramatically increase the odds that you’ll actually review it.
Tools like Google Looker Studio (free) can pull from multiple sources and create visual dashboards that are easy to read at a glance. The full guide to data visualization for small businesses walks through how to set this up without a technical background.
Step 5: Start Testing, Not Just Tracking
Once you have a baseline and a reporting rhythm, the next level is using data to run intentional experiments. Instead of making a change and hoping it works, make a change, define what success looks like, and measure the result.
This could be as simple as: “We’re going to try following up with leads within one hour instead of one day for the next 30 days. We’ll track whether our conversion rate improves.” Or: “We’re running the same Facebook ad with two different headlines for two weeks. We’ll let the click-through rate decide which one to keep running.”
This is the kind of thinking that separates businesses that grow consistently from businesses that grow by accident. Every decision becomes an opportunity to learn something that makes the next decision better. Over time, this compounds.
Step 6: Don’t Let Perfect Be the Enemy of Started
The biggest trap in building a data-driven culture is waiting until you have perfect data, the perfect system, or the perfect time to start. You’ll be waiting a long time.
Start with whatever you have. If you’re only tracking revenue right now, pick one more metric to add this week. If your team doesn’t look at numbers at all, start sharing just one number in your next team meeting. Build the habit first, and the sophistication will follow.
The SBA has solid free resources on financial literacy for small business owners at sba.gov that can help you build the foundational financial literacy you need to make data meaningful in your business.
Link Data to Behavior, Not Just Reporting
Tracking data is only valuable if it changes what you do. After every reporting review, ask: “What does this tell us, and what are we going to do differently because of it?” If the answer is “nothing,” you’re doing reporting theater, not data-driven management.
Even small changes matter. If your review shows that Tuesday afternoons are your highest-converting sales call window, start scheduling more calls on Tuesday afternoons. If your data shows that customers who receive a follow-up within 48 hours have a 30% higher retention rate, build that into your process. The beauty of building a data-driven culture is that the improvements don’t require brilliant strategy. They require consistency and the willingness to act on what the numbers already know.
Pairing this with a structured feedback loop system helps you close the gap between data collection and real change inside your business even faster.
The Bottom Line
Building a data-driven culture isn’t about becoming a tech company. It’s about making fewer gut-driven mistakes and more informed moves. You don’t need to track everything. You need to track the right things, review them consistently, and let what you learn change how you operate.
Start with three core metrics. Build a weekly review rhythm. Share the numbers with your team. Run one small experiment this month. That’s it. Over time, those habits compound into a business that gets sharper with every decision instead of just older.
Want more tools for running a smarter, more profitable business? Join the Hustler’s Library for free and get access to guides, frameworks, and resources built for business owners who are serious about growth.
Ready to Know Where You Stand?
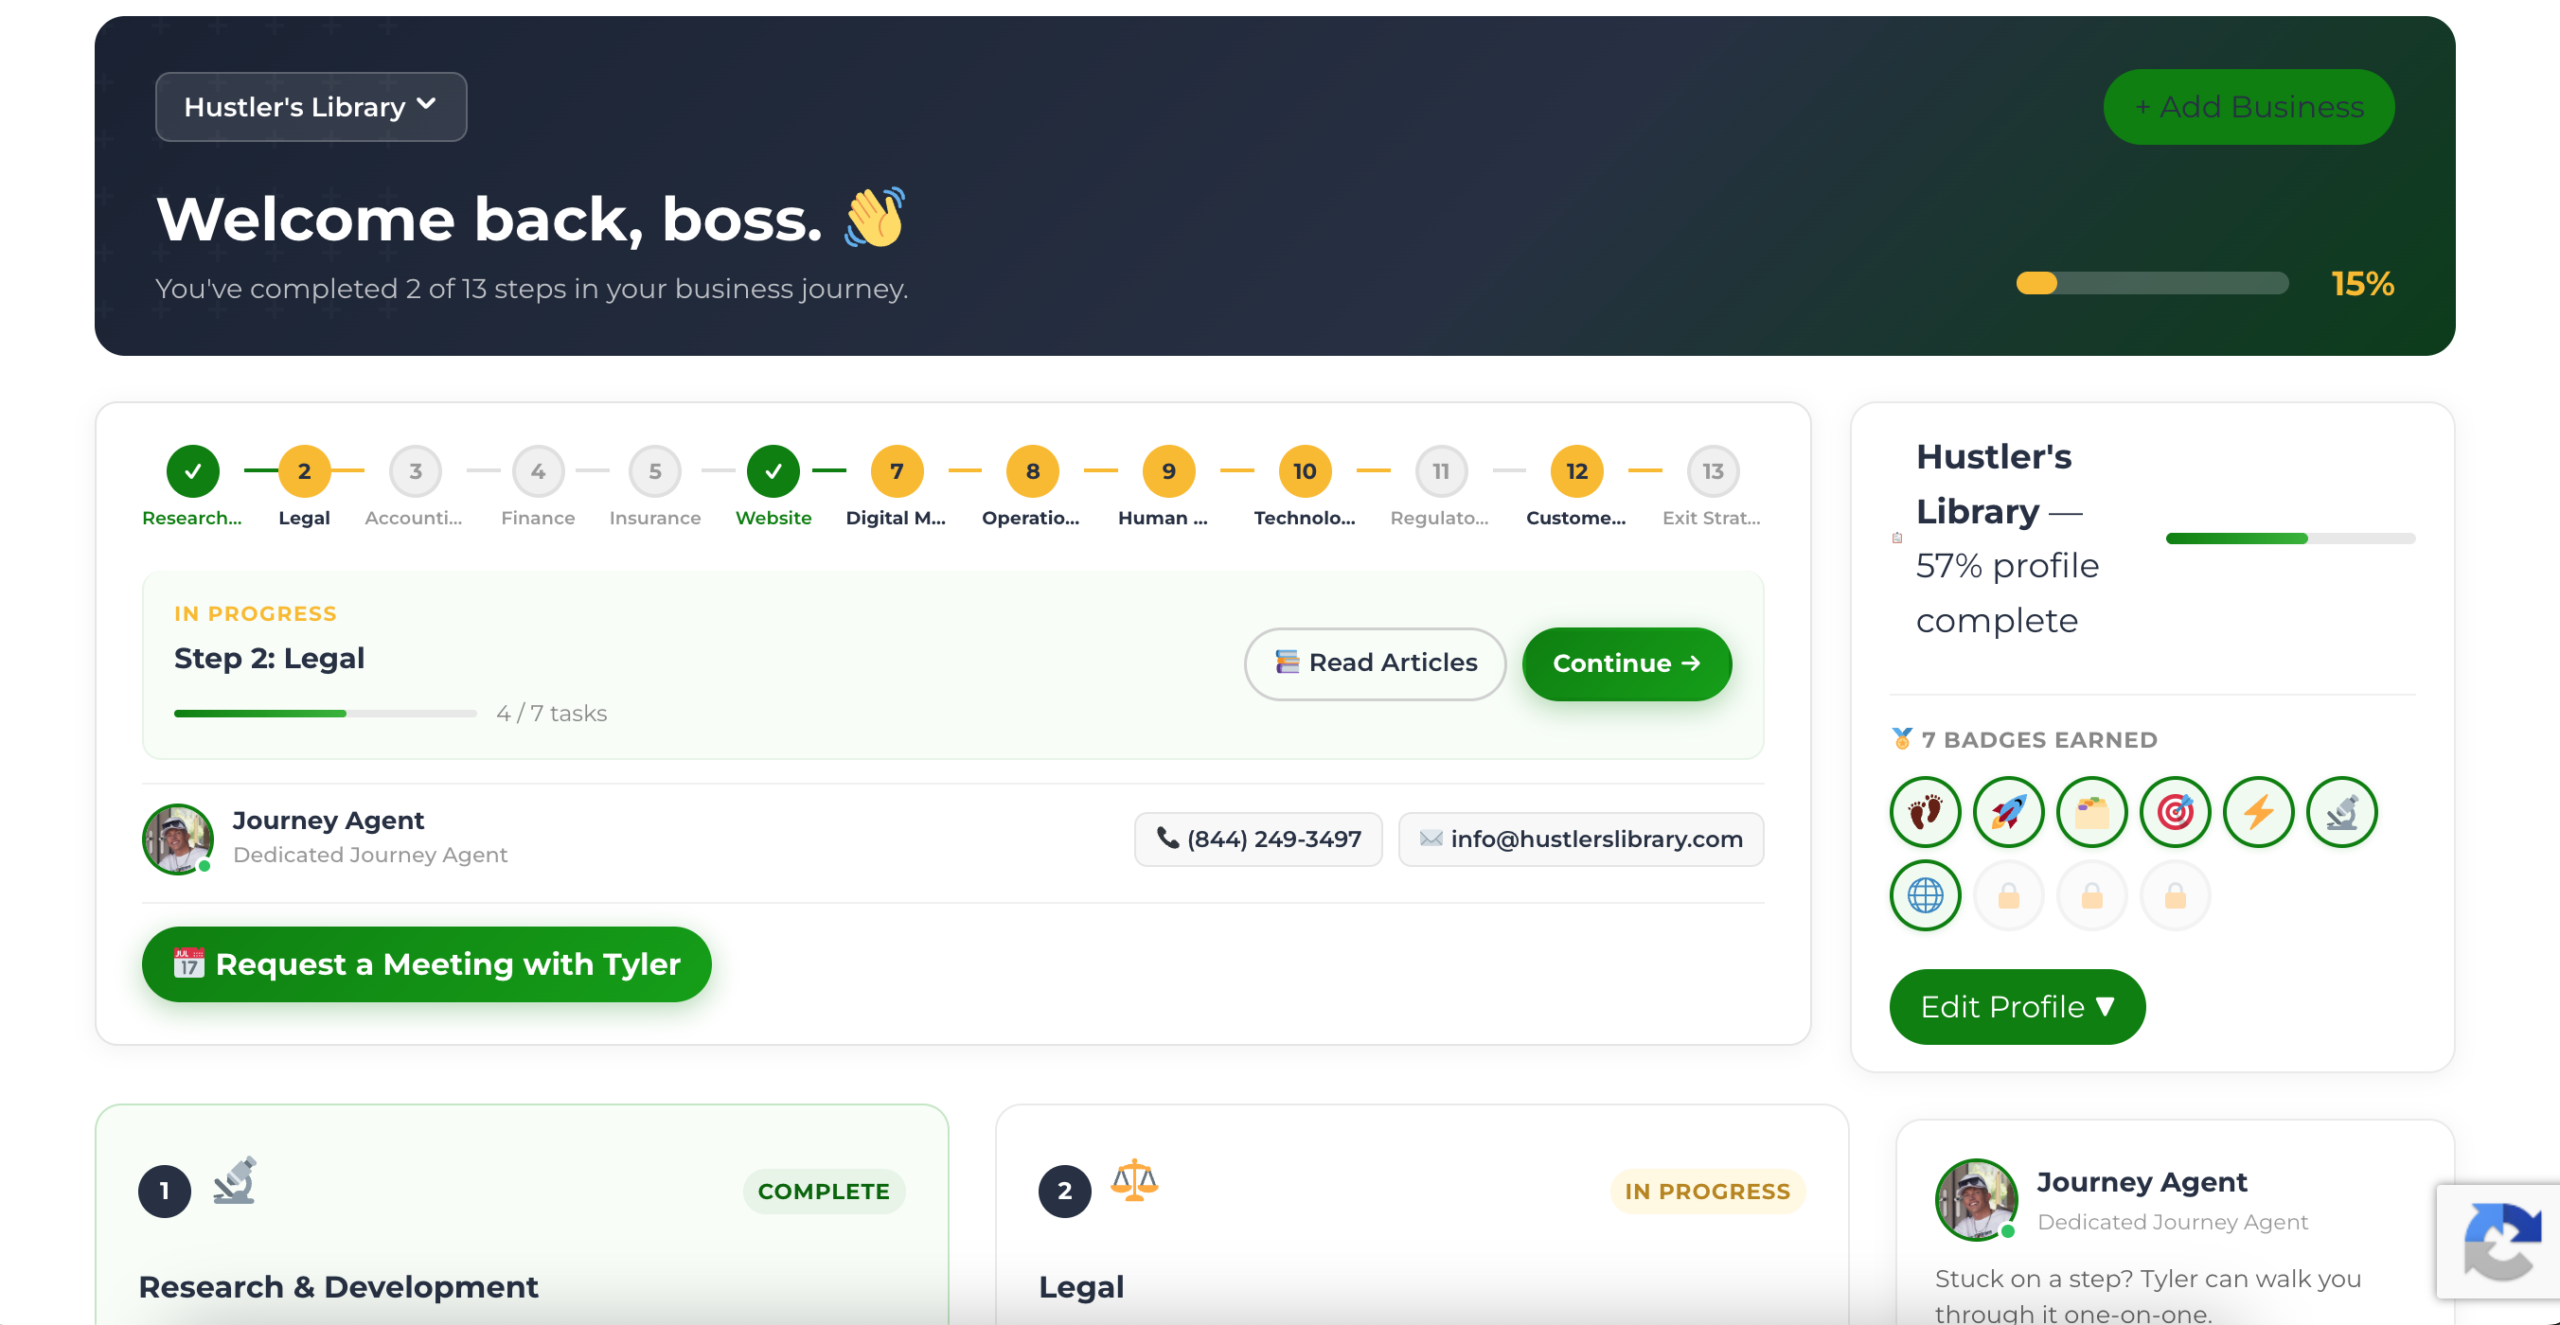
The Business Journey dashboard maps your exact position across all 13 stages. Track your progress, unlock resources for each step, and build with a framework used by thousands of founders at Hustler's Library.
No credit card required · Takes 3 minutes · Personalized to your stage