
Most small business owners are running their companies on gut feel and crossed fingers. They check the bank account on Friday, hope it looks okay, and move on. If something feels off, they dig around in spreadsheets trying to figure out what happened three weeks ago.
There is a better way. A business dashboard gives you a real-time snapshot of the numbers that actually matter, so you can make faster decisions, spot problems before they blow up, and stop wasting time chasing data that should already be in front of you.
This guide will show you what to put on a business dashboard, how to build one without an IT department, and how to actually use it to run your business smarter.
What a Business Dashboard Is (And What It Is Not)
A business dashboard is a single screen or report that pulls together your most important metrics into one place. Think of it like the instrument panel in a car. You do not read every dial every second, but you glance up regularly and if something is wrong, you know immediately.
A dashboard is not a spreadsheet you update once a month. It is not a report you generate for investors. It is a living tool you check regularly, ideally daily or weekly, to keep your finger on the pulse of your business.
Done right, a dashboard answers the most important question in business: Is what I am doing working?
The Four Categories of Metrics Every Small Business Should Track
Before building anything, you need to know what goes on it. Most small businesses need to track four things: revenue, customers, operations, and cash.
1. Revenue Metrics
These tell you whether the business is growing or shrinking.
- Total revenue this week/month vs. last period — Is it up or down?
- Revenue by product or service line — What is actually driving the money?
- Average transaction value — Are customers spending more or less per visit?
2. Customer Metrics
These tell you whether the business is healthy or bleeding from the sides.
- New customers this period — Is your pipeline growing?
- Repeat customer rate — Are people coming back?
- Leads or inquiries — How many people are raising their hand?
Understanding how much each customer is worth over time helps you make smarter decisions about where to spend your marketing dollars. If you have not thought about this yet, check out this guide on how to use customer lifetime value to grow your small business.
3. Operational Metrics
These tell you whether the machine is running smoothly.
- Jobs completed or orders fulfilled vs. open — Is work getting done?
- Average time to complete a job or deliver an order — Are you fast enough?
- Open customer issues or complaints — Where are the fires?
4. Cash Metrics
These keep you from getting blindsided by a cash crisis.
- Cash on hand right now — Can you cover payroll and bills?
- Outstanding invoices (accounts receivable) — What is owed to you?
- Upcoming bills (accounts payable) — What is coming out?
If collecting money is a challenge for your business, you will want to read our guide on how to manage accounts receivable and get paid faster.
How to Actually Build Your Dashboard (Without Spending a Fortune)
Here is the good news: you do not need expensive software, a data analyst, or an IT team. Most small business owners can build a solid dashboard using tools they already have or can get for free.
Option 1: Google Sheets or Excel (Free and Surprisingly Powerful)
For many small businesses, a well-designed spreadsheet is all you need. Create one tab as your dashboard view. Pull data in manually or use built-in functions to pull from other tabs where you log transactions.
Use conditional formatting to make numbers turn red when they drop below target and green when they are on track. It takes a couple of hours to set up and costs nothing.
Option 2: Your Accounting Software’s Built-In Dashboard
If you are using QuickBooks, Wave, FreshBooks, or Xero, you already have a dashboard. Most of these platforms offer a summary view of revenue, expenses, and outstanding invoices. It is not glamorous, but it is accurate and updated automatically.
The problem is that accounting dashboards only show financial data. They will not tell you how many new customers you got or how long your average job is taking. For a fuller picture, you may need to supplement with another tool.
Option 3: A Dedicated Dashboard Tool
Tools like Databox, Klipfolio, Google Looker Studio (free), and Notion can pull data from multiple sources and display it in a clean, visual format. These are great if you have multiple data sources and want everything in one place without manual entry.
Google Looker Studio is free and connects to Google Analytics, Google Sheets, and many other tools. For most small business owners, it is the best balance of power and cost.
Option 4: Your POS or CRM System
If your business uses a point-of-sale system or a CRM, it likely has reporting built in. Square, Shopify, and most CRM platforms give you sales trends, customer counts, and product performance out of the box. Check your settings before you go building something from scratch.
The Five Most Common Dashboard Mistakes Small Business Owners Make
Building a dashboard is easy. Building one that actually helps you is harder. Here are the mistakes that cause most dashboards to get ignored within two weeks.
1. Tracking Too Many Metrics
If your dashboard has 30 numbers on it, you will not look at any of them. Pick five to eight that genuinely drive decisions. Everything else is noise.
2. Tracking Vanity Metrics
Website visits, social media followers, and email open rates feel good but often do not correlate with actual business health. Track metrics that are tied to revenue, customer retention, or cash. If a number going up does not lead to more money or fewer problems, cut it.
3. Not Setting Targets
A number without context is meaningless. Is $18,000 in revenue this week good or bad? You cannot know unless you have a target. Set a weekly or monthly goal for each metric on your dashboard and track your performance against it. If you need help thinking through your targets, this guide on setting business goals that actually move the needle is worth reading.
4. Only Looking at Historical Data
Your dashboard should not just tell you what happened. It should help you see what is about to happen. Include leading indicators, metrics that predict future performance, alongside lagging indicators that confirm what already happened. New leads and booked appointments are leading indicators. Revenue collected is lagging.
5. Building It Once and Never Updating It
Your business changes. The metrics that mattered in year one are not always the metrics that matter in year three. Review your dashboard quarterly and ask whether each metric is still worth tracking. Add new ones as priorities shift and cut anything that no longer informs decisions.
How to Build a Dashboard Review Habit
The best dashboard in the world does not help you if you only look at it twice a year. Building a regular review rhythm is just as important as building the dashboard itself.
Daily (5 minutes): Glance at cash on hand, revenue for the day, and any open issues. This keeps you from getting blindsided.
Weekly (15-30 minutes): Review all metrics against targets. What is ahead of plan? What is behind? What one thing would make the biggest difference this week?
Monthly (1-2 hours): Look at trends over the last few months. Are you improving? Plateauing? Declining? Use this session to make bigger decisions, like adjusting pricing, shifting marketing spend, or changing your team structure.
The SBA recommends that small business owners regularly review key financial and operational indicators as part of healthy business management. You can explore their business management resources at sba.gov.
A Simple Starting Template for Your First Dashboard
If you are not sure where to start, here is a simple framework. Put these eight metrics on your first dashboard and you will be miles ahead of most small business owners.
- Revenue this week/month vs. target and same period last year
- New customers this period vs. target
- Repeat customer rate — percentage of customers who bought more than once
- Average transaction value vs. target
- Outstanding invoices — total dollars owed to you
- Cash on hand — what is actually in the account
- Open leads or inquiries — how full is your pipeline?
- Top issue or bottleneck — the one thing slowing you down right now
That last one is not a number. It is a note you update each week. It forces you to name the biggest obstacle in your business and keeps it visible until it gets solved.
Stop Running Your Business Blind
Most small business owners make decisions with incomplete information and hope for the best. A dashboard does not eliminate uncertainty, but it dramatically reduces the number of surprises that should not have been surprises.
You do not need expensive software. You do not need a team of analysts. You need five to eight honest metrics, a place to track them, and a habit of actually looking at them. That is it.
Start this week. Pick your eight metrics. Drop them in a spreadsheet. Set targets. Look at it every morning for one week and see how differently you operate.
The business owners who grow are not always the smartest or the hardest working. They are often just the ones who know what is actually happening inside their company.
Ready to take your business to the next level? Join the Hustler’s Library community for the tools, guides, and strategies that serious entrepreneurs actually use. Join free right here.
Ready to Know Where You Stand?
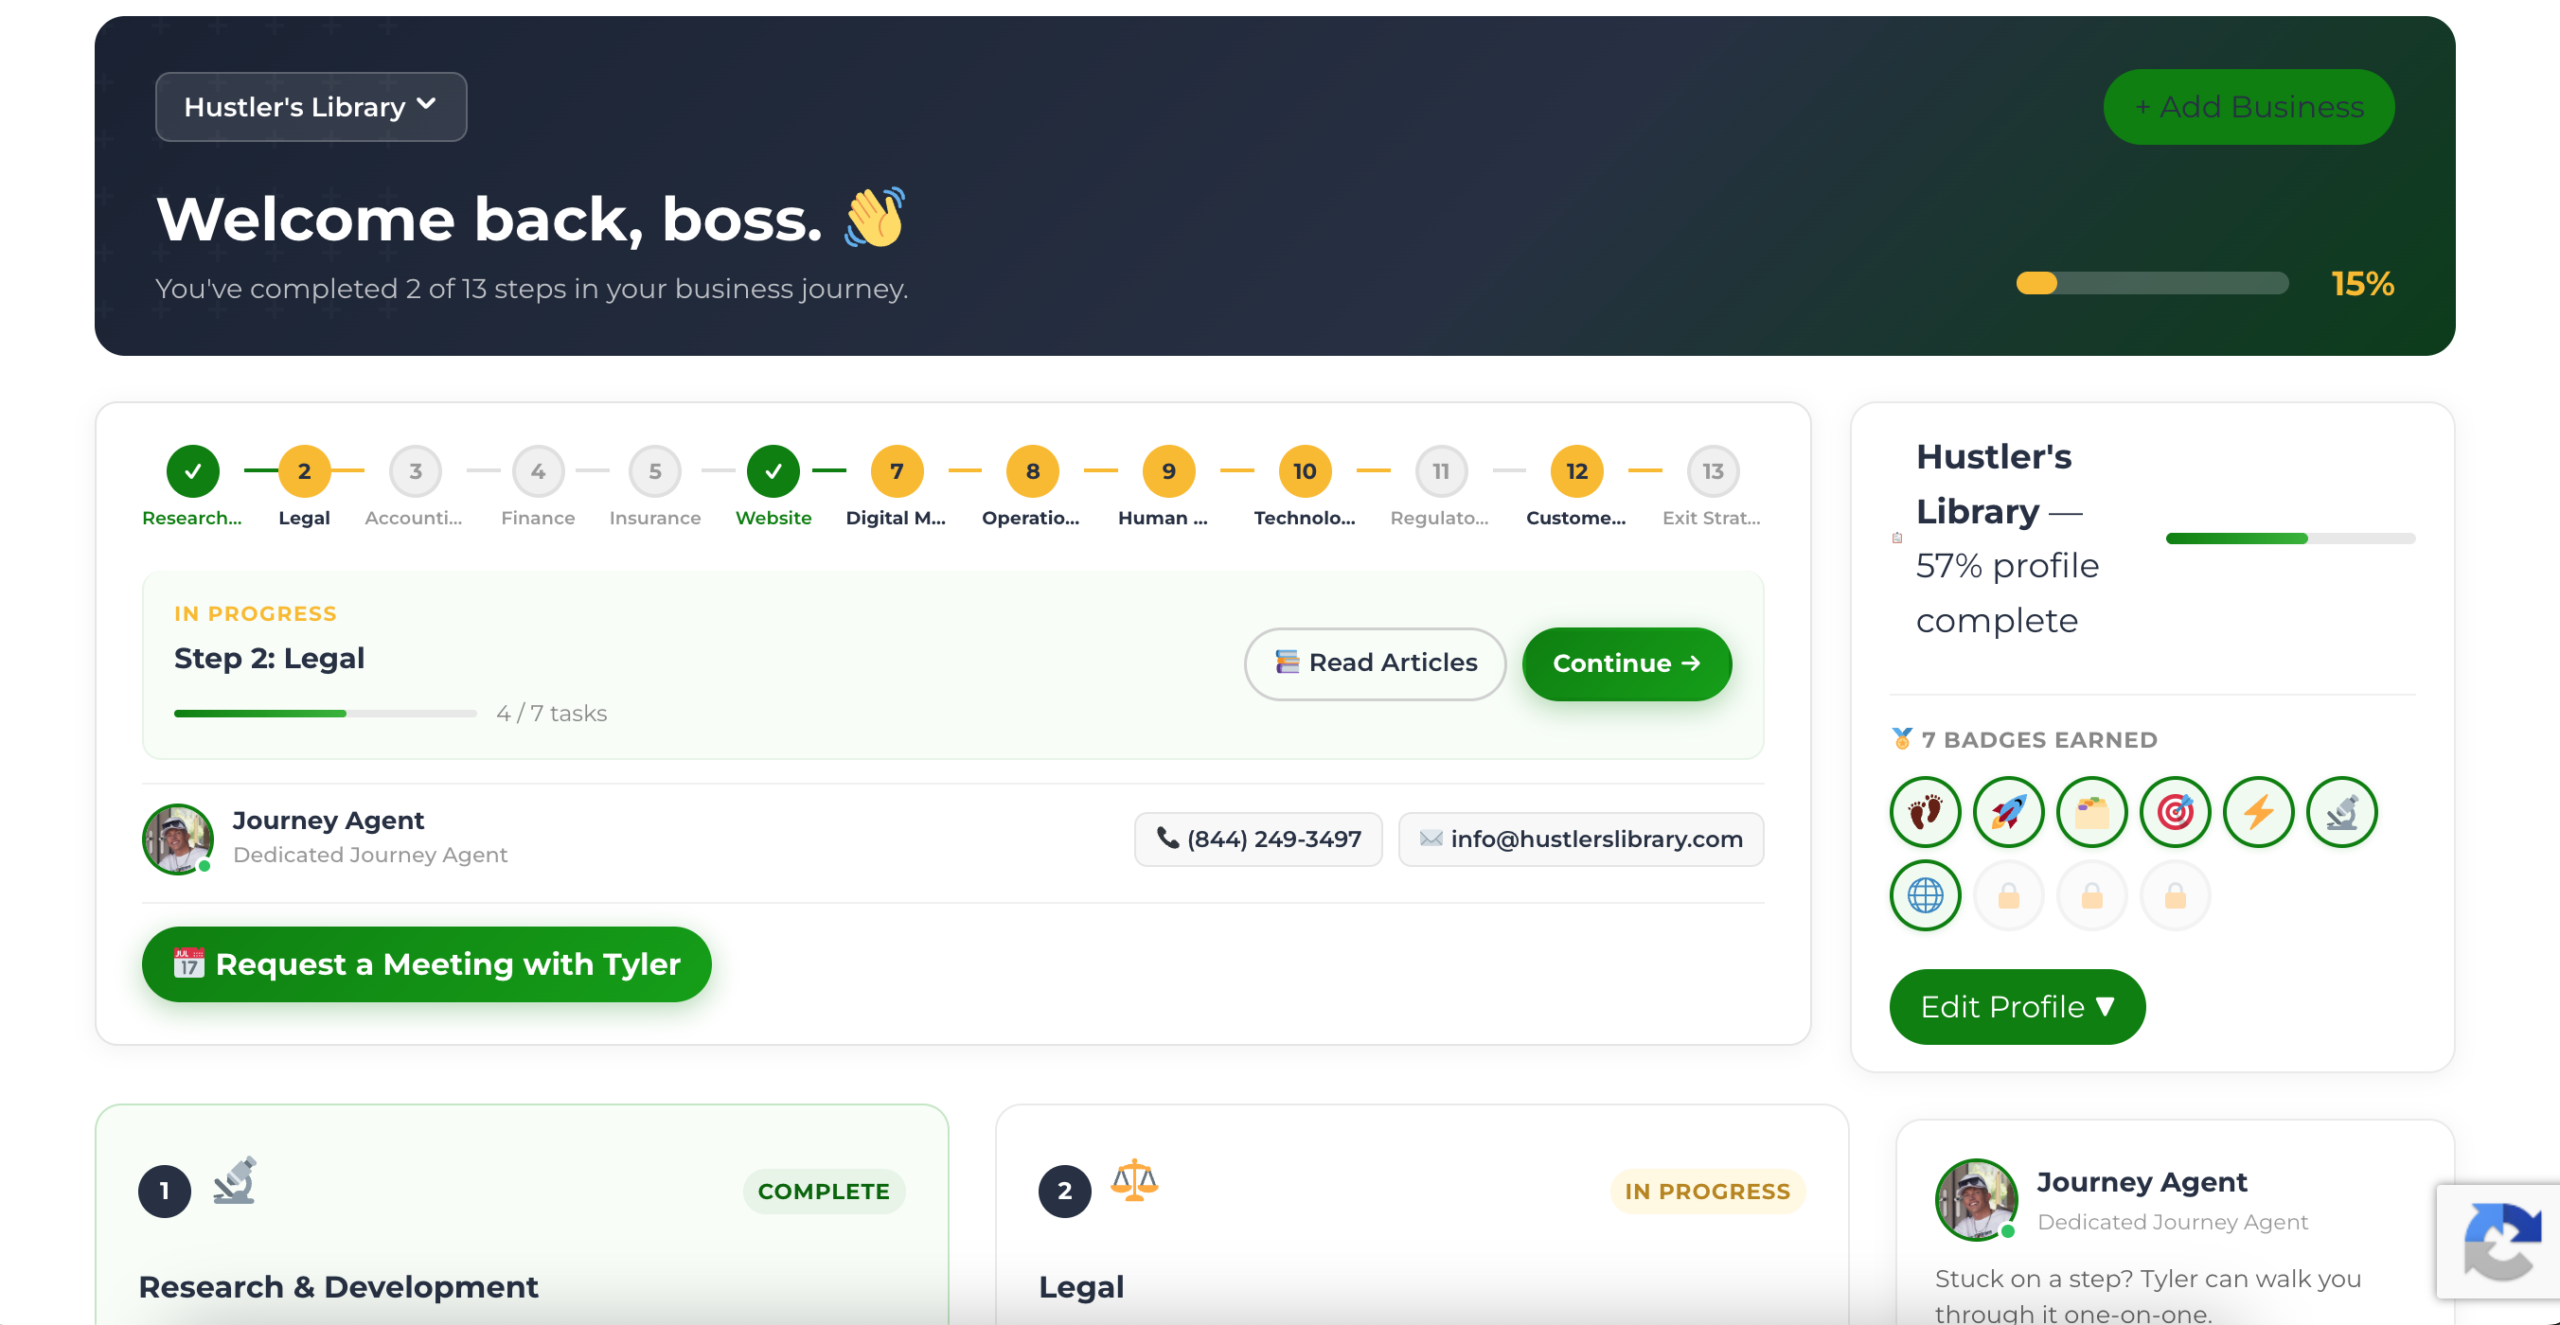
The Business Journey dashboard maps your exact position across all 13 stages. Track your progress, unlock resources for each step, and build with a framework used by thousands of founders at Hustler's Library.
No credit card required · Takes 3 minutes · Personalized to your stage