
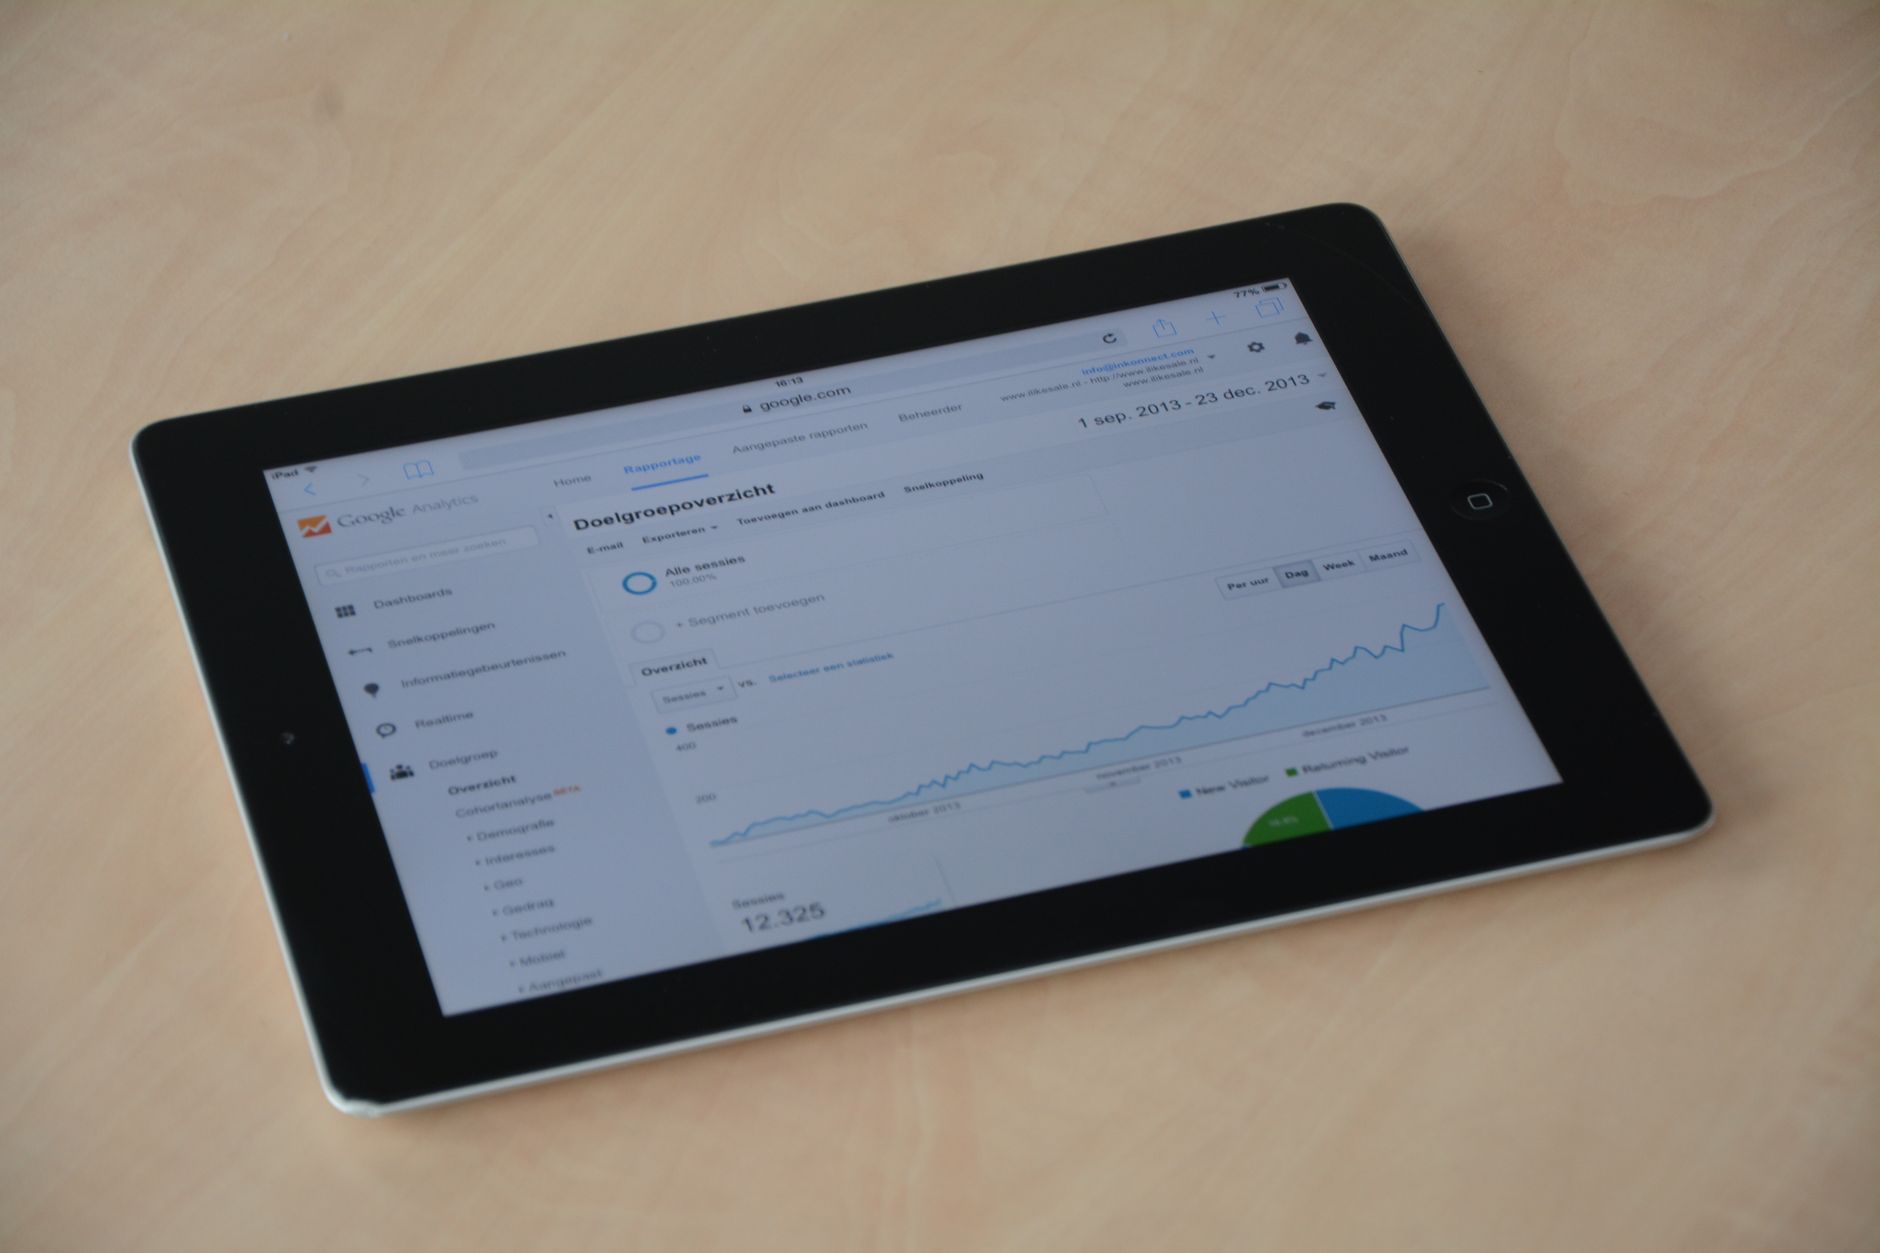
Most small business owners set up Google Analytics, check that the code is installed, and then never open it again. The dashboard feels overwhelming, the terminology is confusing, and it is not immediately obvious how any of it translates to more customers or more revenue.
That is a huge missed opportunity. Google Analytics is one of the most powerful free tools available to any business owner. Think with Google found that businesses that actively use analytics data grow revenue at twice the rate of those that don’t. Once you understand what to look at and why it matters, you will have a clearer picture of your customers than most businesses three times your size.
This guide skips the jargon and shows you exactly how to use Google Analytics to make smarter decisions for your business, even if you are not a tech person.
Why Google Analytics Matters for Small Business Owners
Your website is not just a digital brochure. It is a 24/7 sales and marketing machine, and Google Analytics is the control panel that tells you how well it is working.
Without it, you are guessing. With it, you can answer questions like: Where are my customers coming from? Which pages are driving sales? Where are people dropping off before they buy? What is bringing in the most traffic? Which marketing channels are actually worth the effort?
These are not abstract questions. They directly affect where you spend your time and your money. A business owner who knows their numbers can double down on what works and cut what does not.
Setting Up Google Analytics the Right Way
If you are using Google Analytics 4 (GA4), which is the current version, you need a Google account and a GA4 property linked to your website. Most website platforms, including WordPress, Squarespace, Shopify, and Wix, have built-in Google Analytics integrations or plugins that handle installation without any code.
Once installed, give it a few days to collect data before drawing any conclusions. One day of data tells you almost nothing. A week tells you more. A month gives you a real picture.
One critical setup step that many small business owners skip: configure your conversions. A conversion is any action that matters to your business, whether that is someone filling out a contact form, clicking your phone number, making a purchase, or signing up for your newsletter. Without conversion tracking, you will have traffic data but no way to connect it to actual business outcomes.
The Five Reports Every Small Business Owner Should Know
1. Acquisition Overview
This report shows you where your visitors are coming from. Traffic is typically broken into channels: organic search (people finding you on Google), direct (people typing your URL), social (traffic from social media platforms), referral (links from other websites), and paid search (ads you are running).
Look at this report first when you want to understand your marketing ROI. If 70 percent of your traffic comes from organic search and your social media posts are driving almost nothing, that tells you something important about where to focus your energy. If you have been investing in a marketing channel and it is not showing up in this report, it is time to reassess.
2. Pages and Screens
This report tells you which pages on your website get the most traffic. Your homepage is usually at the top, but look deeper. Which blog posts or service pages are people actually reading? Which pages have the highest engagement time, meaning visitors are actually sticking around?
High-traffic pages with low engagement time are a warning sign. It usually means visitors are landing on the page and immediately leaving because it did not match what they were looking for. That page is a candidate for a rewrite.
High-traffic pages with strong engagement are assets. They are working hard for you. Make sure those pages have clear calls to action and are optimized to move visitors toward a purchase or inquiry.
3. Landing Pages
A landing page is the first page someone sees when they arrive at your site. This report tells you which entry points are performing best and which ones are losing visitors immediately.
Pay attention to the bounce rate equivalent in GA4, which is called the engagement rate. A low engagement rate on a landing page means most people are arriving and leaving without doing anything. This is valuable information because it points directly to where your website is failing to convert interest into action.
4. Audience Demographics
Google Analytics can give you a general profile of your visitors, including age ranges, geographic location, and in some cases the devices they are using. This data is aggregated and anonymized, so it is not about any individual, but it gives you a useful sense of who is actually showing up to your digital front door.
If most of your visitors are on mobile devices but your website is hard to navigate on a phone, that is a serious problem worth fixing immediately. If your visitors are concentrated in a specific region you did not expect, that might point to a marketing opportunity you have not tapped yet. This pairs well with insights from understanding your customer lifetime value, which helps you determine who is worth targeting most aggressively.
5. Conversions
If you have set up conversion tracking, this is your most important report. It tells you which traffic sources, pages, and campaigns are actually driving the actions that matter to your business, not just traffic.
A channel that sends you 1,000 visitors but zero conversions is less valuable than one that sends you 100 visitors and 10 conversions. Volume without outcomes is noise. This report cuts through the noise.
How to Turn Data Into Decisions
The mistake most business owners make is looking at data without asking what to do about it. Here is a simple framework that makes analytics actionable.
Look weekly, act monthly. Check your key metrics once a week so you notice trends early. Make actual changes to your marketing and website once a month based on what you have observed. Weekly course-corrections based on too little data lead to thrashing, not improvement.
Identify your top three pages and protect them. Your highest-traffic, highest-engagement pages are your best digital assets. Do not redesign them without a good reason. Do make sure they are linked to from other pages on your site and have a clear next step for visitors.
Find your worst-performing entry point and fix it. Every month, pick the landing page with the worst engagement rate and figure out why. Is the page slow to load? Does the headline not match the search intent? Is there no obvious call to action? Small fixes on high-traffic pages can move the needle significantly. This connects directly to building a business dashboard that keeps your key numbers front and center.
Double down on your best traffic source. Once your acquisition report shows you which channel is sending the most engaged visitors, invest more in that channel. If organic search is your engine, publish more optimized content. If referral traffic from a specific partner site is converting well, strengthen that relationship.
Common Mistakes to Avoid
Obsessing over vanity metrics. Total page views and overall traffic are satisfying numbers to look at, but they mean very little on their own. Focus on engagement rate, conversion rate, and which channels drive actual results.
Not filtering out your own traffic. If you spend a lot of time on your own website testing things, building pages, or reviewing content, your visits are inflating your data. GA4 allows you to filter out internal traffic so the data reflects real visitors only.
Comparing periods incorrectly. A Tuesday in December is not comparable to a Tuesday in July. When you compare date ranges, use the year-over-year comparison or compare the same time period from the previous cycle to get a meaningful read on whether things are improving.
Ignoring mobile. The majority of web traffic now comes from smartphones. If your analytics show a high percentage of mobile visitors but low engagement, the problem is almost certainly your mobile experience, not your content.
Going Deeper: Connecting Analytics to Your Marketing
Google Analytics becomes even more powerful when you connect it to Google Search Console, which shows you which search queries are bringing people to your site, and to Google Ads if you run paid campaigns. Together, these three tools give you a complete picture of your online marketing funnel from the moment someone searches for a product or service to the moment they convert on your website.
The Google Analytics Help Center offers free guided tutorials and explanations for every report, which makes it a useful resource if you want to go beyond the basics without paying for a course.
For small business owners focused on local traffic, the combination of Google Analytics and Google Business Profile is particularly powerful. Analytics tells you what people do when they arrive at your site. Business Profile tells you what they searched for before they found you. Together, they give you the full picture of your local customer journey. To get the most out of local search specifically, it helps to combine analytics insights with a strong local SEO strategy.
Start Small and Build the Habit
You do not need to understand every report in Google Analytics to get value from it. Start with the five reports outlined above. Spend 15 minutes once a week reviewing your acquisition overview and your top-performing pages. Set up at least one conversion event so you can start connecting traffic to outcomes.
Over time, you will develop an intuition for your numbers. You will start to notice when something is off before it becomes a problem. You will know which marketing investments are working and which ones are wasting your budget. That kind of clarity is genuinely rare among small business owners, and it is entirely free.
Analytics is not a tech thing. It is a business intelligence thing. And the business owners who pay attention to it consistently outperform the ones who fly blind.
Want more tools, guides, and strategies to help you run a smarter business? Join the Hustler’s Library for free and get access to the full resource vault.
Ready to Know Where You Stand?
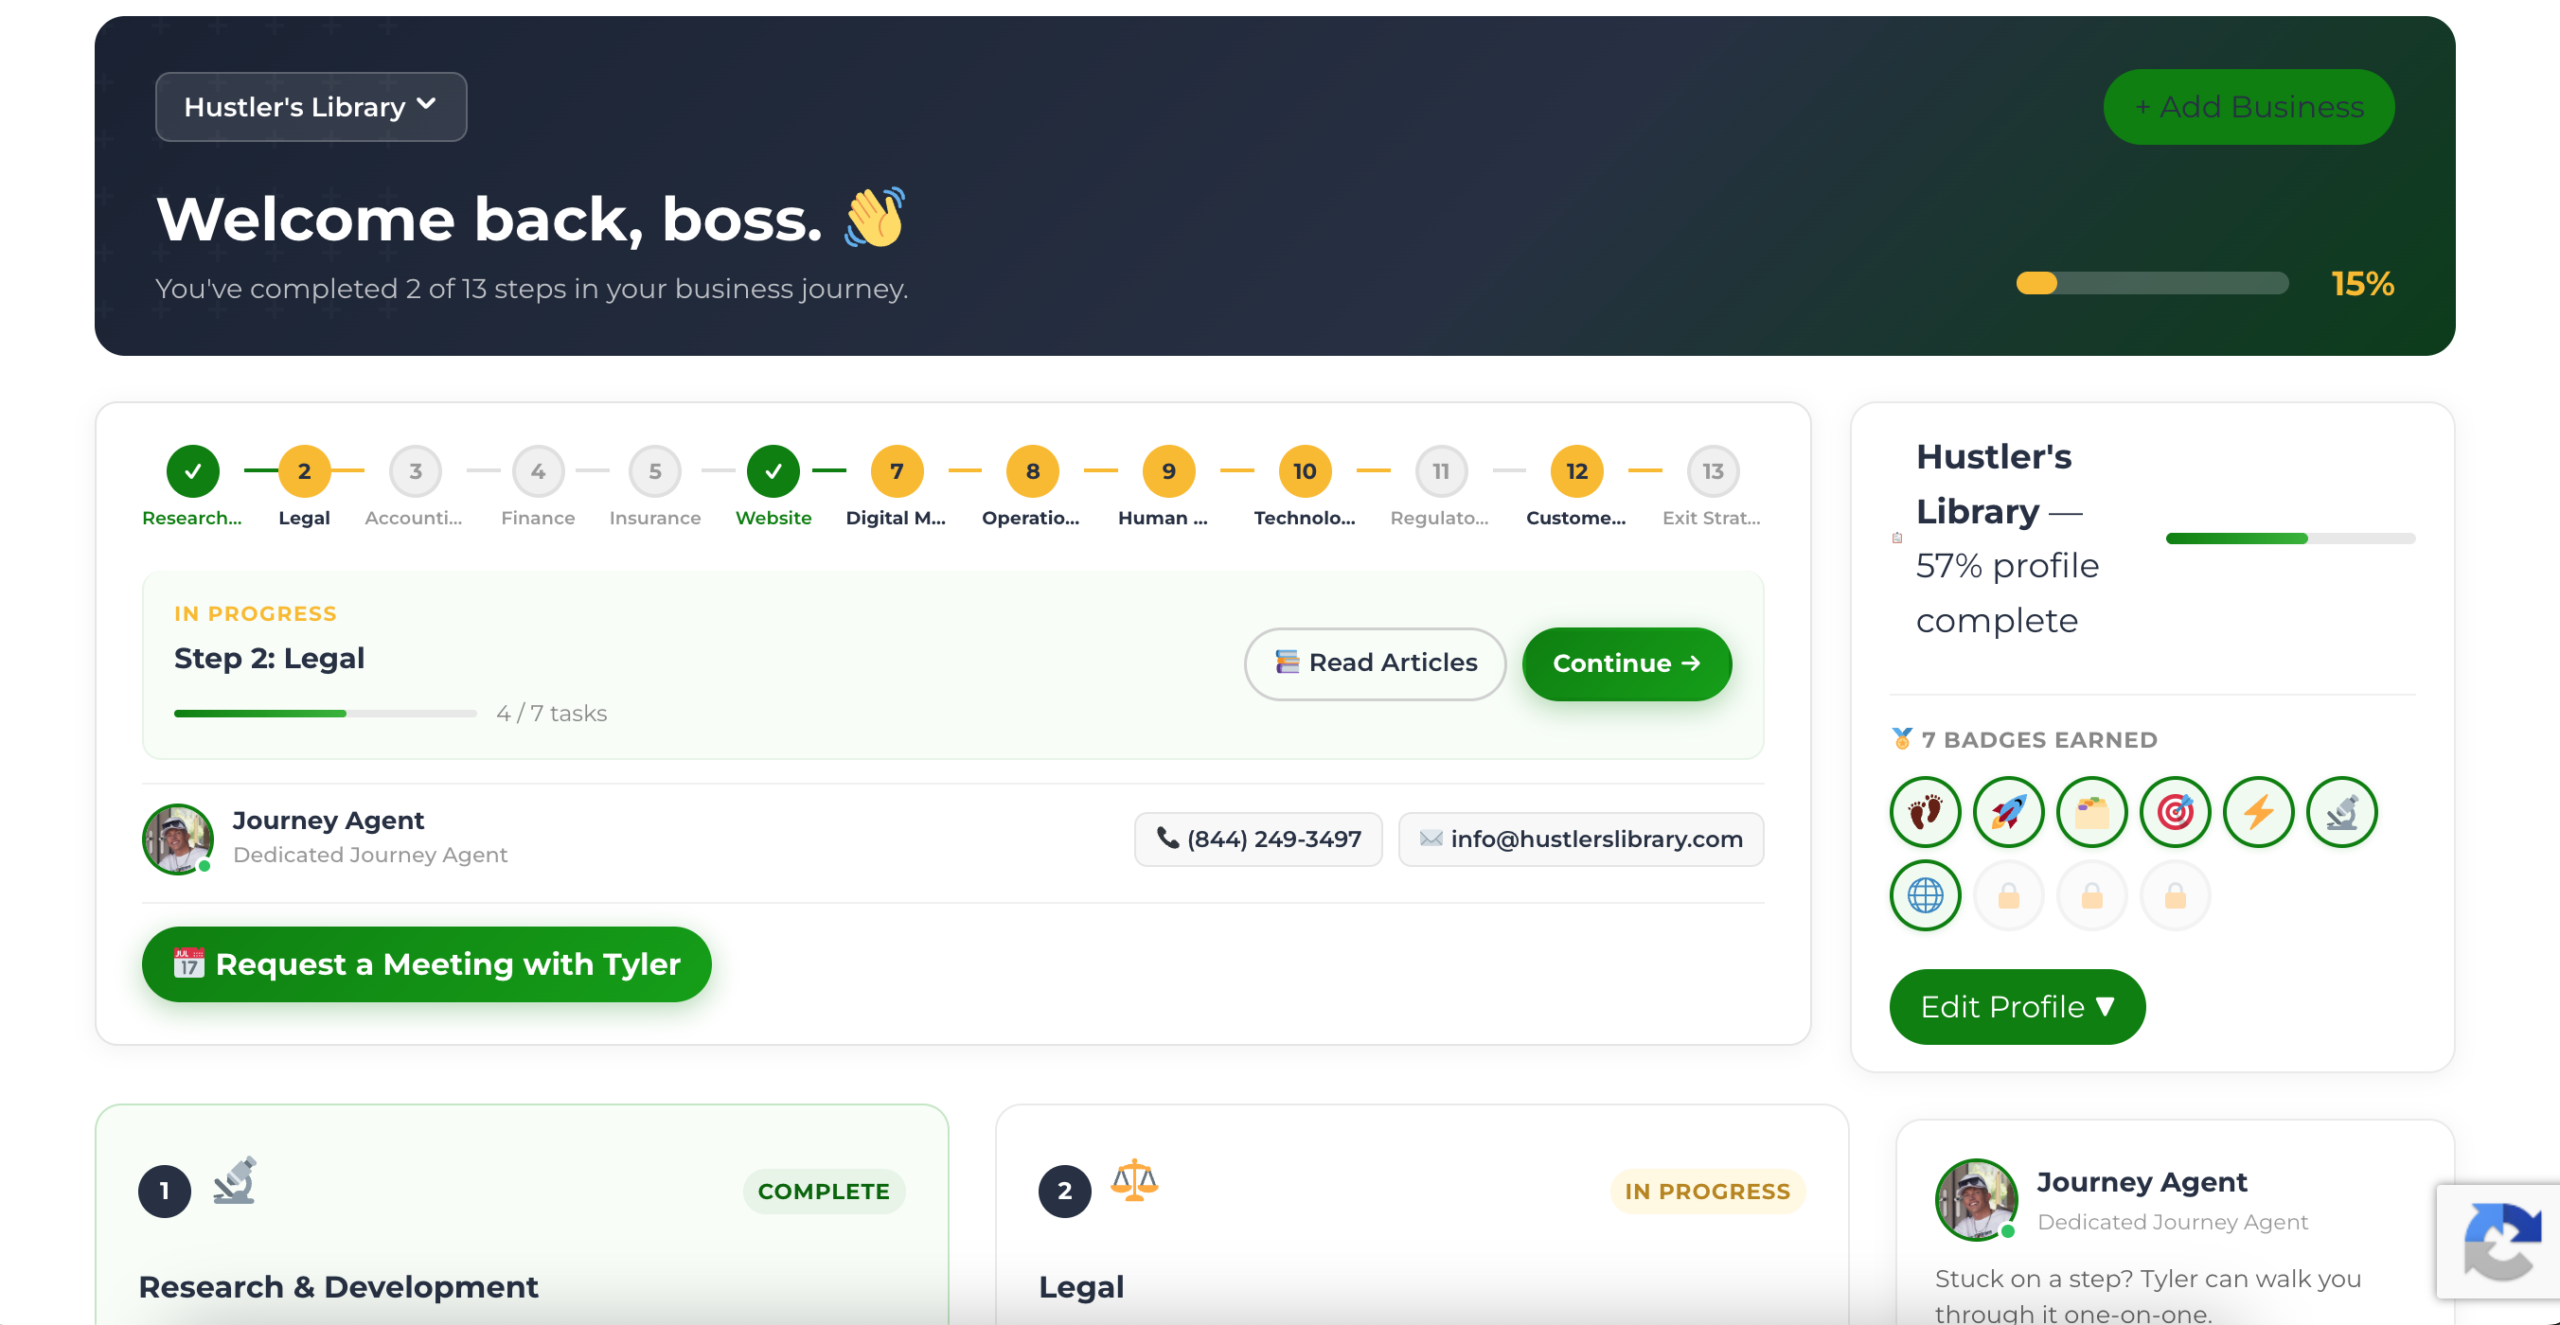
The Business Journey dashboard maps your exact position across all 13 stages. Track your progress, unlock resources for each step, and build with a framework used by thousands of founders at Hustler's Library.
No credit card required · Takes 3 minutes · Personalized to your stage