
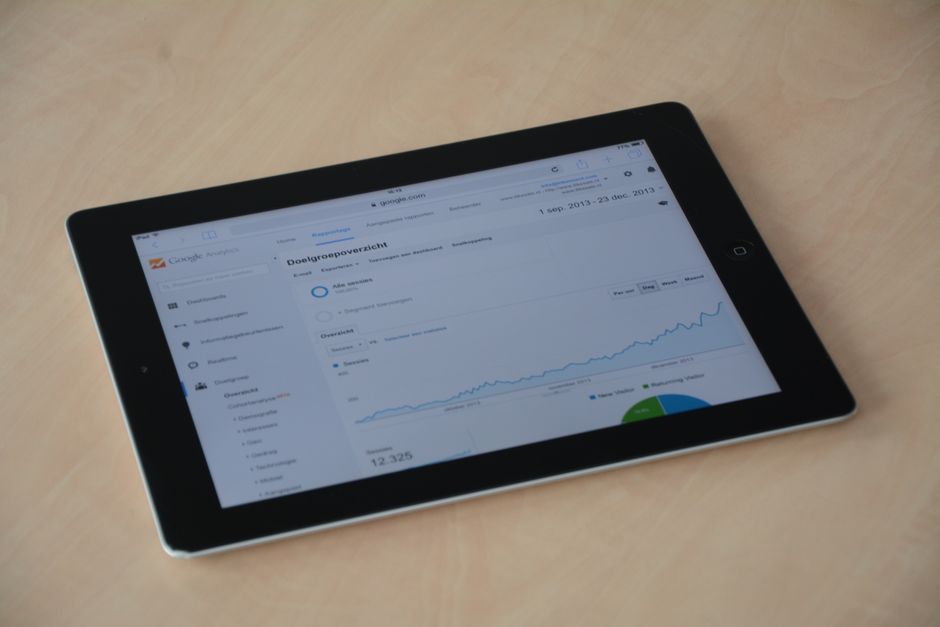
Most small business owners set up Google Analytics once and never look at it again. It sits there quietly, collecting data, while they keep making decisions based on gut instinct and guesswork. That’s a missed opportunity. Your website is one of your most important business assets, and Analytics tells you exactly what’s working, what’s not, and where your customers are coming from. You just need to know what to look at.
This guide breaks down the metrics that actually matter, how to read them without a data science degree, and how to turn those numbers into real business decisions.
Start With Google Analytics 4 (GA4)
If you’ve been using Universal Analytics, it’s gone. Google shut it down in 2024 and migrated everyone to GA4. GA4 is event-based instead of session-based, which means it tracks user behavior differently. The interface looks different too, but the core principles haven’t changed. If you haven’t set up GA4 yet, start there: go to Google’s official GA4 setup guide to connect it to your site. Once it’s collecting data for at least a week, you’re ready to dig in.
The Five Numbers That Actually Matter
GA4 shows you hundreds of metrics. Most of them are noise. Focus on these five to start:
1. Users and Sessions
Users is the number of individual people who visited your site in a given period. Sessions is the number of visits, meaning one user can have multiple sessions if they come back. Watch both over time. A rising user count means your reach is growing. If sessions are growing faster than users, your existing visitors are coming back more often, which is a healthy sign of engagement.
2. Traffic Channels
This is where your visitors are coming from: organic search, direct (they typed your URL), paid ads, social media, referrals from other websites, or email. Go to Reports > Acquisition > Traffic Acquisition to see the breakdown. Your goal is to understand which channels are driving actual business results, not just raw traffic. A hundred visitors from organic search who spend four minutes on your site beats five hundred social media clicks who bounce in ten seconds.
3. Engagement Rate
GA4 replaced the old “bounce rate” with engagement rate, which is the percentage of sessions where someone actually did something: stayed longer than ten seconds, visited a second page, or triggered a conversion event. An engagement rate above 60% is generally solid. Below 40% means visitors are landing and leaving without any real interaction, which signals a problem with either the traffic quality, the page content, or the load speed.
4. Top Pages
Under Reports > Engagement > Pages and Screens, you’ll see which pages get the most views. Your homepage being number one makes sense. But look at what’s behind it. Are people reading your pricing page? Your about page? Certain blog posts? This tells you what content resonates and what offers are getting attention. If a product page gets high traffic but low conversions, the page itself needs work. If a blog post is driving tons of organic traffic, write more on that topic.
5. Conversions
A conversion is any action that matters to your business: a form submission, a phone call click, a purchase, a sign-up. GA4 lets you mark specific events as conversions. If you haven’t done this yet, it’s the single most important setup step. Without conversion tracking, you’re just watching numbers move without knowing if any of it translates to money. Set up at least one conversion event tied to your core business goal.
How to Read the Data Without Overthinking It
The biggest mistake business owners make with analytics is looking at absolute numbers in isolation. One hundred users isn’t good or bad. It depends on your industry, your marketing spend, and where you were last month. Always compare: week over week, month over month, and against your own historical baseline. Look for trends, not snapshots.
Use the date comparison feature in GA4. Set it to compare the last 30 days against the previous 30. If traffic is up 20% but conversions are flat, you’re driving the wrong traffic. If traffic is flat but conversions are up, something on your site improved. These patterns tell a story.
Also pay attention to the device breakdown. Under Reports > User > Tech, you can see how much traffic comes from mobile vs. desktop. If more than half your visitors are on mobile and your site isn’t optimized for it, you’re losing customers before they even read a sentence. This connects directly to your overall competitive position, since slow or broken mobile experiences are a fast way to lose ground. If you haven’t already done a competitive audit, a competitive analysis can help you see how your digital presence stacks up against rivals in your market.
Turn Data Into Decisions
Analytics only has value if it changes what you do. Here’s a simple framework for making that happen:
- Weekly check (5 minutes): Look at users and conversions. Up or down? Any big swings worth investigating?
- Monthly review (30 minutes): Compare month over month across all five core metrics. Identify your top-performing page and your worst-performing page. Make one change to each.
- Quarterly deep dive: Review your traffic channel mix. Are you too dependent on one source? If 80% of your traffic comes from one channel and it dries up, you’re in trouble. Diversify intentionally.
This rhythm keeps you data-informed without turning into a full-time analyst. The goal isn’t to become obsessed with metrics. The goal is to make better decisions faster. And that pairs well with your broader customer strategy: knowing where visitors drop off, for example, is just as important as keeping the customers you already have.
A Few GA4 Features Worth Knowing
Explorations: GA4’s free-form reporting tool lets you build custom reports. You can create a funnel exploration to see exactly where users drop off between your homepage and your checkout or contact page. This is powerful for diagnosing conversion problems.
Audiences: You can create audience segments based on behavior. For example, people who visited your pricing page but didn’t convert. Export that audience to Google Ads to run retargeting campaigns at a fraction of the cost of cold traffic.
Search Console integration: Connect Google Search Console to GA4 and you’ll see which search queries are driving traffic to which pages. This is free keyword research and tells you exactly what your potential customers are searching for before they find you.
The Google Analytics Help Center covers all of these features in detail and is regularly updated as the platform evolves. If you’re setting up custom events or integrating with ad platforms, it’s worth bookmarking.
Keep It Simple and Stay Consistent
You don’t need to master every feature of GA4 to get real value from it. Start with the five core metrics. Set up at least one conversion event. Look at the data on a regular schedule. If you do just those three things consistently, you’ll make smarter decisions than the majority of small business owners who either ignore their data entirely or look at it without any plan for acting on it.
Your website is working around the clock to attract and convert customers. Analytics is how you find out whether it’s actually doing its job. Use it.
Want more guides like this? Join Hustler’s Library for free and get practical business resources delivered straight to your inbox.
Ready to Know Where You Stand?
The Business Journey dashboard maps your exact position across all 13 stages. Track your progress, unlock resources for each step, and build with a framework used by thousands of founders at Hustler's Library.
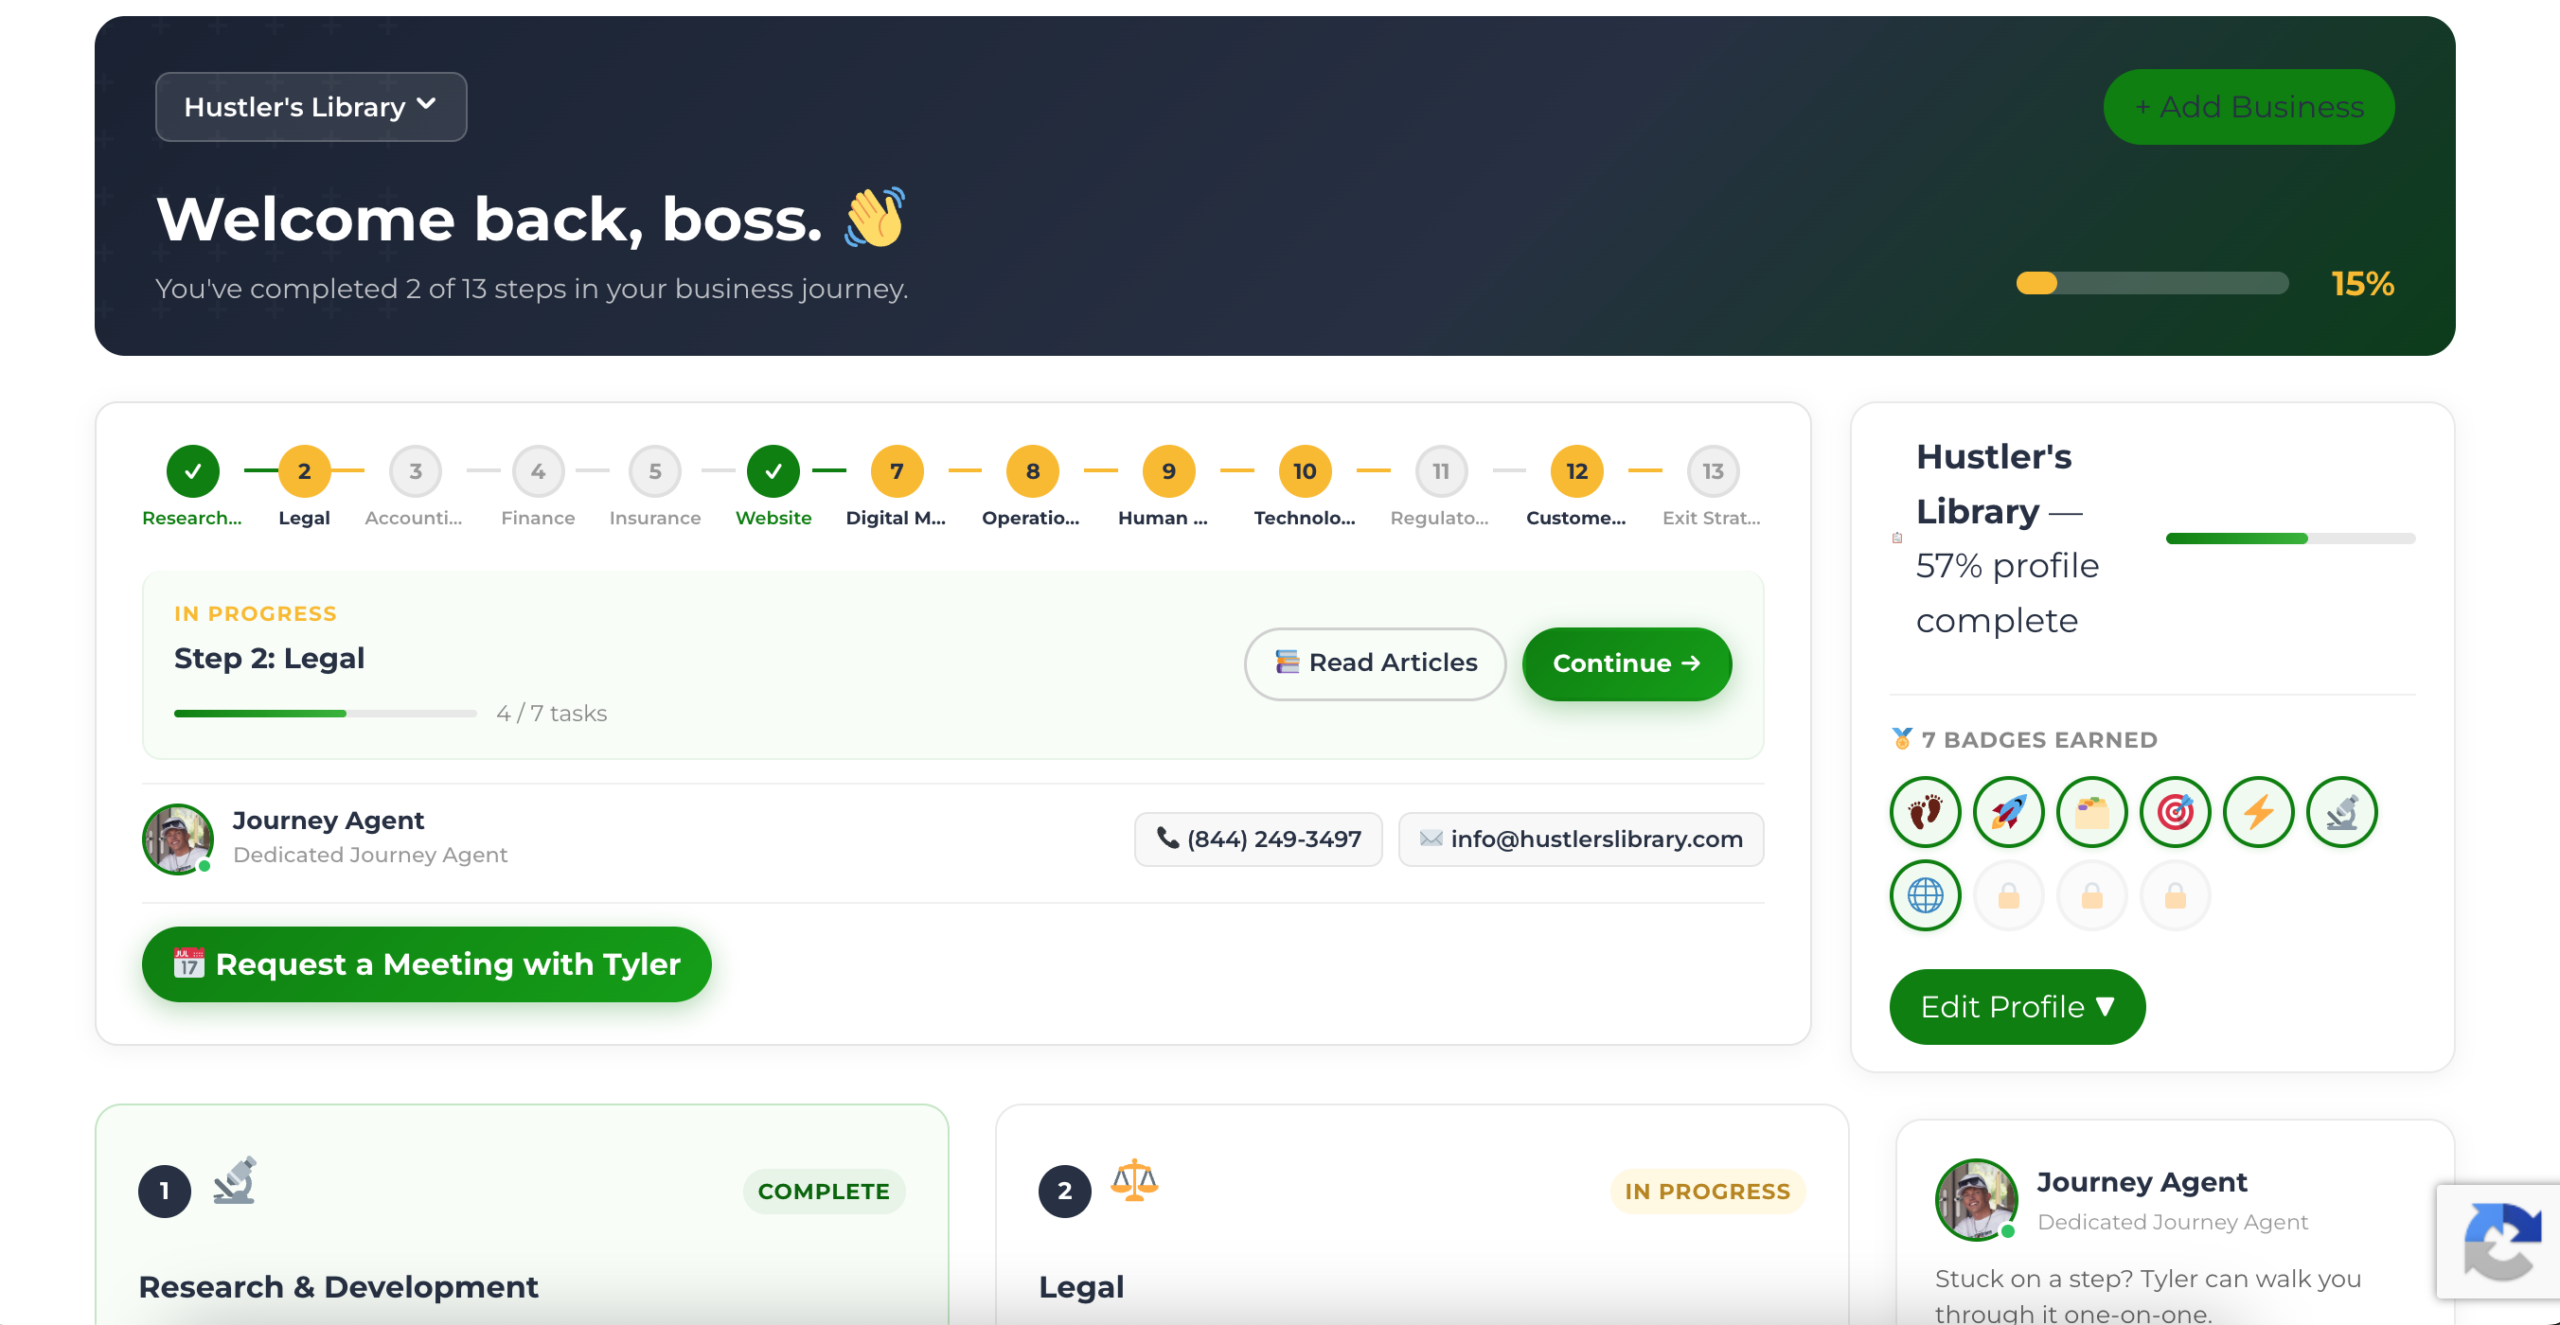
No credit card required · Takes 3 minutes · Personalized to your stage