

You’ve heard it a thousand times: a picture is worth a thousand words. In marketing, that’s not a cliche. It’s a business strategy.
Infographics, those visual blends of data, design, and storytelling, are one of the most effective and underused tools in the small business marketing toolkit. Done right, they get shared, linked to, remembered, and acted on. Done wrong, they’re just colorful clutter.
This guide will show you exactly how to use infographics to build authority, drive traffic, and win more customers for your small business, no design degree required.
Why Infographics Work
The human brain processes visuals 60,000 times faster than text. When you present information visually, your audience absorbs it more quickly, retains it longer, and shares it more readily.
For small business owners, that translates to real advantages:
- More social media shares: Infographics are shared three times more than any other type of content on social media.
- Better SEO: When your infographic gets embedded on other websites, you earn backlinks that boost your search rankings.
- Stronger brand authority: A well-designed infographic signals that you know your industry and can communicate it clearly.
- Higher engagement: Readers scroll past walls of text. They stop for visuals that deliver value at a glance.
And unlike paid ads, a great infographic can keep driving traffic and leads for months or even years after you create it.
Step 1: Choose the Right Type of Infographic
Not all infographics are the same. The format you choose should match the information you’re communicating and the action you want your audience to take.
Statistical Infographics
Best for presenting research, survey results, or industry data. If you want to back up a point with numbers, this is your format. Example: “7 Stats Every Small Business Owner Needs to Know About Customer Retention.”
Process Infographics
Best for showing how something works step by step. These are ideal for service businesses explaining their process or for how-to guides. Example: “How Our 5-Step Onboarding Process Works.”
Comparison Infographics
Best for helping buyers make decisions. Side-by-side comparisons cut through confusion and position your offer favorably. Example: “DIY vs. Hiring a Pro: What’s Really Worth It?”
Timeline Infographics
Best for telling your brand story, showing the history of your industry, or illustrating a project timeline. Great for building credibility and connection with your audience.
List Infographics
Best for tips, tools, or resources. These are easy to scan and tend to perform well on Pinterest and LinkedIn. Example: “10 Free Tools Every Small Business Owner Should Be Using.”
Start with one format that fits a piece of content you already have or a question your customers ask repeatedly. You don’t need to reinvent the wheel. You need to make the information visually digestible.
Step 2: Pick a Topic That Earns Attention
The best infographic topics are ones that answer a real question, solve a specific problem, or make a complex idea simple. Think about:
- Questions your customers ask you all the time
- Common misconceptions in your industry
- Processes that are confusing or intimidating to newcomers
- Stats or data that would surprise your target audience
- Comparisons your ideal customer is already trying to make
Knowing your customer deeply matters here. If you haven’t built a clear picture of exactly who you’re selling to, check out How to Create an Ideal Customer Profile for Your Small Business before you spend time creating content for a vague audience.
You don’t need original data to make a great infographic. You can curate and visualize publicly available statistics from industry reports, government sources like the Small Business Administration, or credible publications. Just cite your sources clearly in the infographic itself.
Step 3: Create the Infographic (Even If You’re Not a Designer)
You do not need Adobe Illustrator or a graphic design background to make professional-looking infographics. The tools available today make it straightforward for anyone.
Free and Low-Cost Tools
- Canva: The most beginner-friendly option. Hundreds of free infographic templates, drag-and-drop editing, and a free tier that covers most small business needs.
- Piktochart: Built specifically for infographics and data visualization. Excellent for statistical and process formats.
- Visme: A solid mid-tier option with strong data visualization tools and presentation features.
- Adobe Express: Adobe’s simplified design tool with solid templates and more polish than Canva for users who want cleaner output.
Design Principles That Matter
You don’t need to be a designer, but a few basic principles separate a polished infographic from an amateur one:
- Stick to your brand colors. Consistency builds recognition. Use the same two or three colors throughout.
- Limit your fonts. One font for headers, one for body text. No more.
- Use white space generously. Crowded infographics are exhausting to read. Give each element room to breathe.
- Lead with the most important information. Readers scan top to bottom. Put your hook at the top.
- Include your logo and website. Every infographic you create is a branding asset. Watermark it.
If design truly isn’t your thing, this is a great use case for hiring a freelancer. Platforms like Fiverr have hundreds of experienced graphic designers who specialize in infographics, often at surprisingly reasonable rates for one-off projects.
Step 4: Distribute Your Infographic Strategically
Creating the infographic is only half the work. Distribution is where most small business owners drop the ball.
Publish It on Your Website
Embed your infographic in a full blog post. Include a written version of the information beneath the image for SEO purposes. Search engines can’t read images, but they can read text. This combination of visual and written content gives you the best of both worlds.
Share It on Social Media
Different platforms favor different infographic formats:
- Pinterest: Long, vertical infographics perform extremely well here. Pinterest users actively search for and save this type of content.
- LinkedIn: Works best for business-focused, data-driven infographics. B2B audiences engage heavily with visual content on LinkedIn.
- Instagram: Square or vertical formats. Great for tips-based or list infographics broken into carousel posts.
- Facebook: Horizontal or square. Works well for process and comparison infographics targeting local audiences.
Submit to Infographic Directories
Sites like Visual.ly and Infographic Journal allow you to submit your infographics for free. If your infographic gets featured, you earn additional backlinks and exposure without any extra work on your part.
Pitch It to Industry Publications
If your infographic contains original data or genuinely useful industry information, pitch it to trade publications, blogs, and news sites in your niche. Many content editors are actively looking for visual assets to include in their articles. When they publish your infographic, you get a backlink and new audience exposure.
Include an Embed Code
Make it easy for other websites to share your infographic by providing a simple HTML embed code. This is a classic link-building technique that still works. Every time someone embeds your infographic, your website link travels with it.
Step 5: Repurpose Your Infographic Across Channels
A single infographic can fuel your marketing for weeks if you repurpose it intelligently.
- Break it into individual slides for an Instagram carousel or LinkedIn slideshow
- Pull individual statistics or tips out as standalone social posts
- Use sections of it as visual aids in a presentation or proposal
- Include it in a newsletter to add visual interest and drive clicks back to your blog
- Convert it into a short explainer video by animating the sections
The more touchpoints you create, the more chances your potential customers have to see your message and remember your brand. That kind of consistent visual presence is what separates businesses that get remembered from ones that get ignored.
Step 6: Track What Works
Like any marketing tactic, infographics need to be measured. Set up tracking before you publish so you know what to improve over time.
- Website traffic: Use Google Analytics to track visits to the page where your infographic lives. Compare it to your other blog posts.
- Social engagement: Track shares, saves, and comments across platforms. Which infographic formats get the most traction?
- Backlinks: Use a tool like Google Search Console or Ahrefs to see who links to your infographic pages. This is your SEO return on investment showing up in real time.
- Lead generation: If you gate a high-value infographic behind an opt-in form, track how many email addresses it generates.
Use what you learn to inform your next infographic. Double down on what works. Retire what doesn’t. This is part of the broader feedback loop of building a consistent, effective marketing presence, which you can strengthen further with a strong brand style guide that keeps all your visual assets looking cohesive.
Common Mistakes to Avoid
- Too much text: If you’re writing full sentences in every section, it’s not really an infographic. Trim ruthlessly.
- Ignoring mobile: Most of your audience will view your infographic on a phone. Make sure text is legible without zooming.
- No clear takeaway: Every infographic should leave the reader with one key insight or action. If yours tries to do too much, it ends up doing nothing.
- Forgetting to brand it: An unbranded infographic that gets shared 500 times is a missed opportunity. Always include your logo and URL.
- Publishing and disappearing: Too many business owners post an infographic once and move on. Reshare it across seasons, topics, and platforms. Great content deserves multiple chances to be seen.
Start Small, Build a System
You don’t need to launch an infographic empire on day one. Start with one infographic per month based on a question you get asked constantly. Pick the format that fits the information. Keep the design simple. Distribute it to three or four places. Measure the results.
Over time, you’ll build a library of visual assets that drive traffic, earn links, and position your business as a trusted authority in your market. That’s compounding marketing at its best.
The best time to start was last year. The second-best time is today.
Want more plain-English playbooks for growing your business? Join Hustler’s Library free and get the strategies that actually move the needle.
Ready to Know Where You Stand?
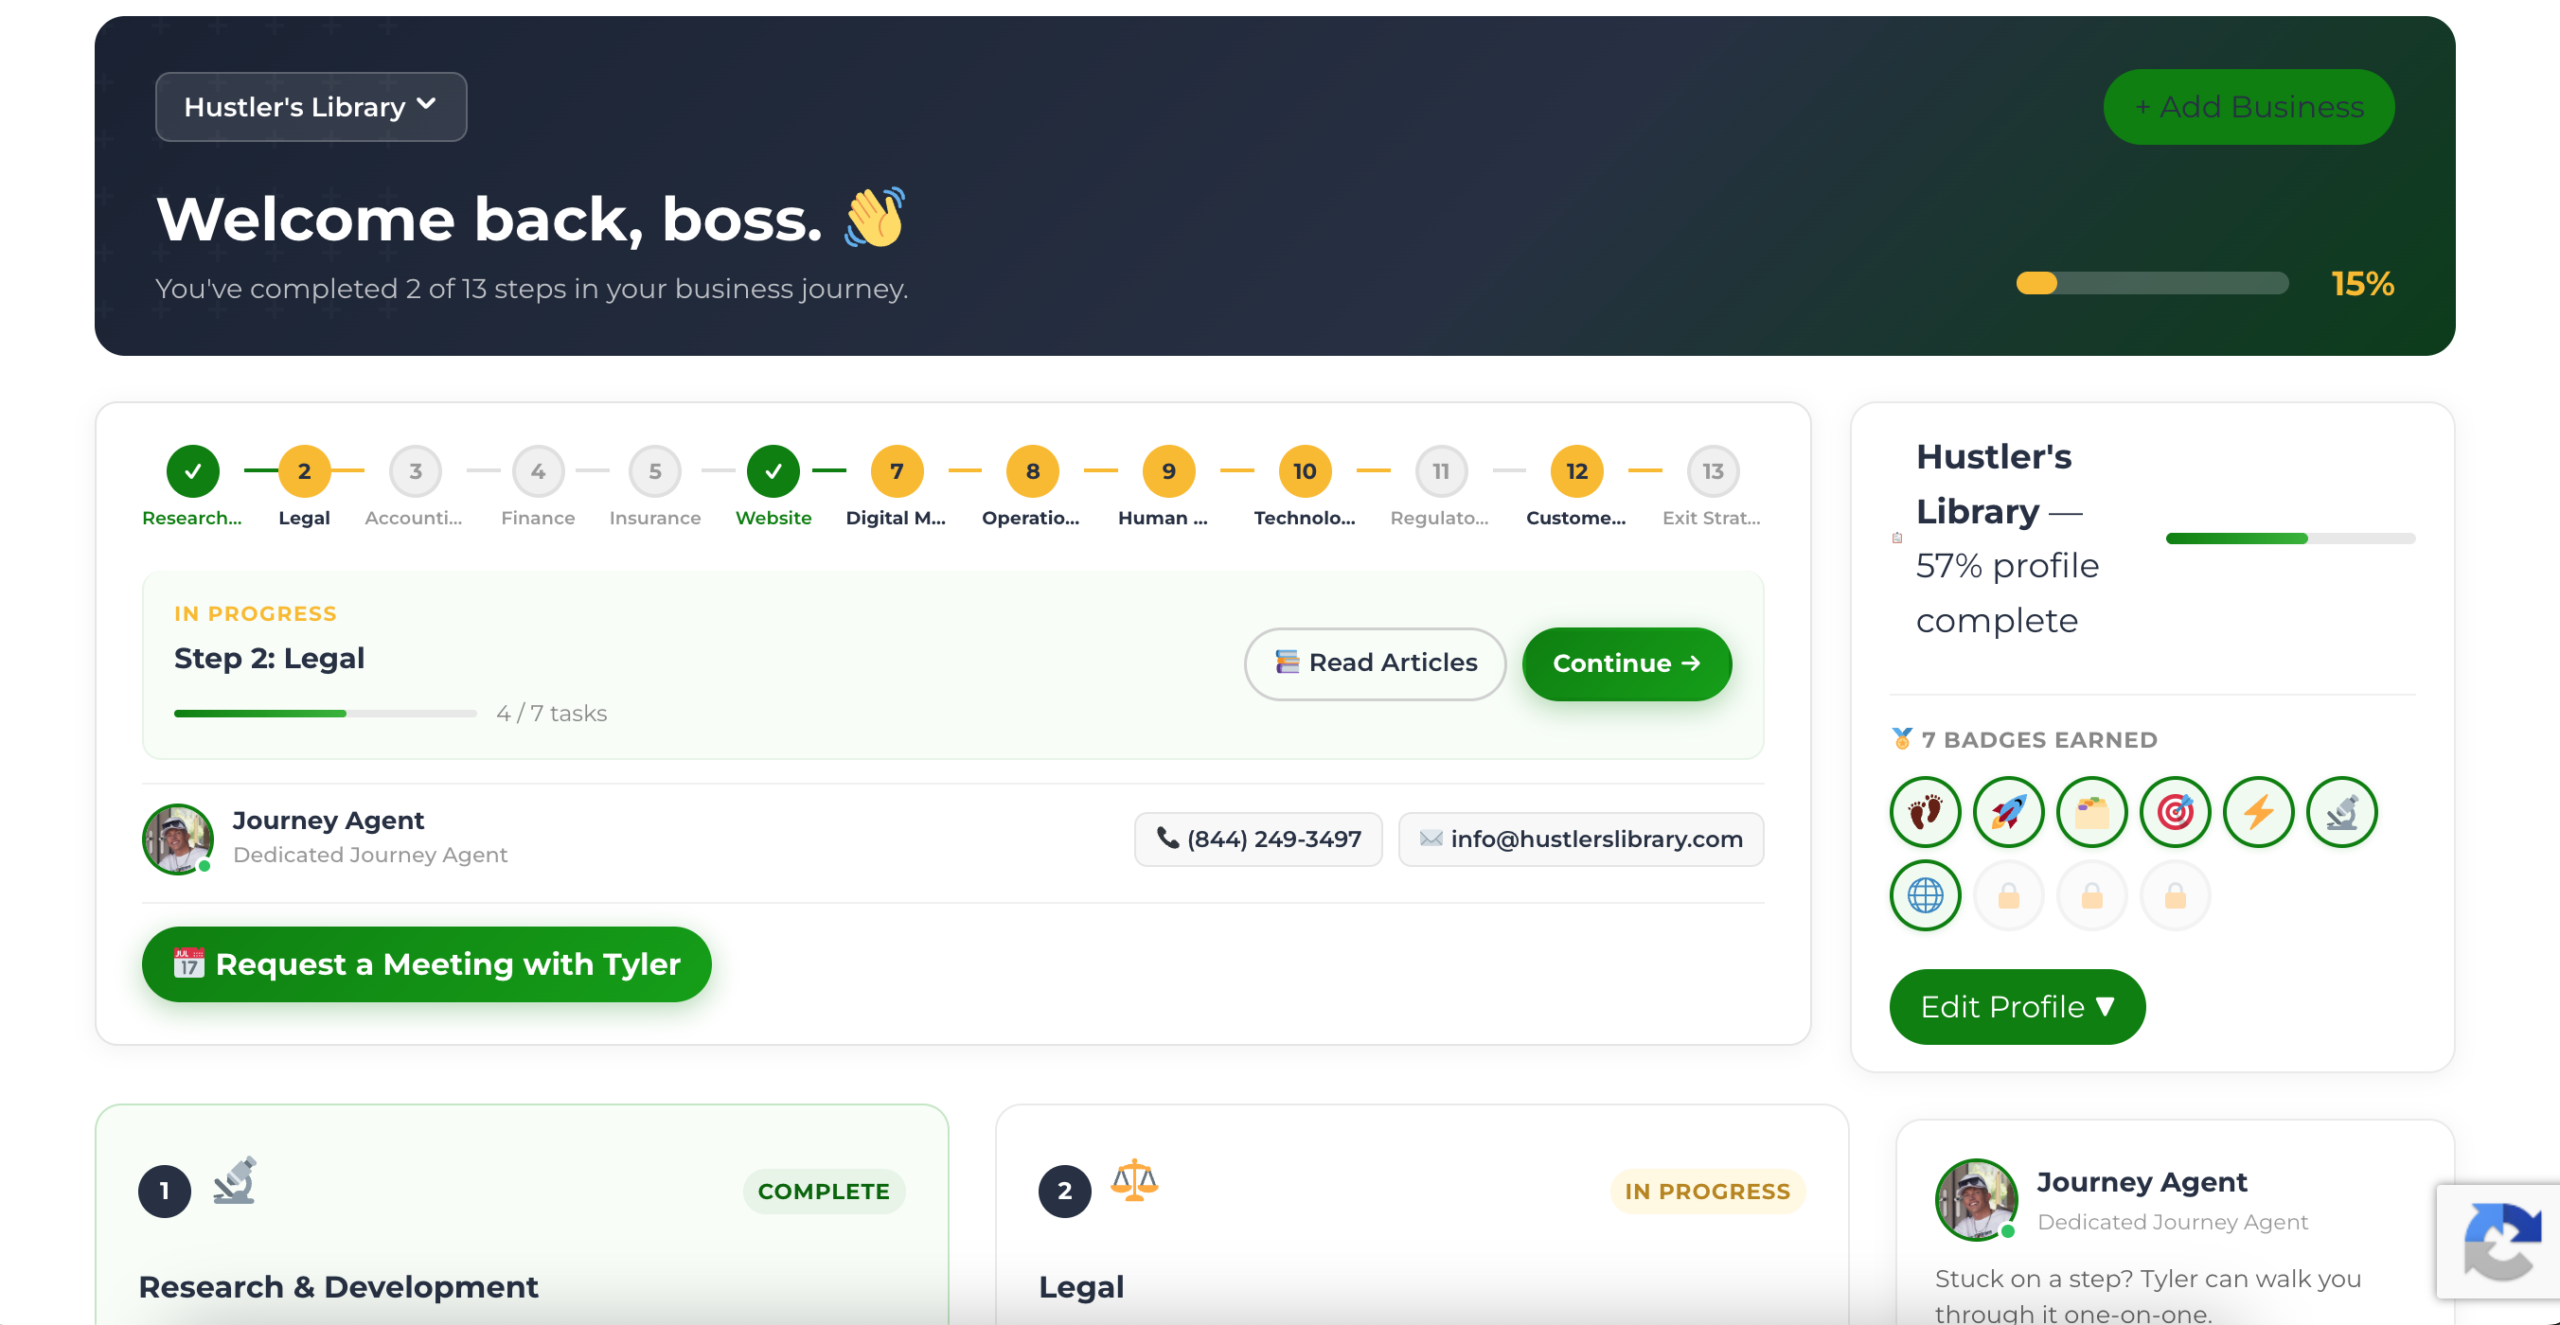
The Business Journey dashboard maps your exact position across all 13 stages. Track your progress, unlock resources for each step, and build with a framework used by thousands of founders at Hustler's Library.
No credit card required · Takes 3 minutes · Personalized to your stage