

Every successful business decision is really just a bet. The question is whether you’re betting blind or betting with the best information available. Most small business owners rely on gut instinct and word of mouth. The ones who consistently outmaneuver their competition? They know how to use industry reports and market data to make smarter calls.
This guide will show you where to find that data, how to read it without a business degree, and how to actually put it to work for your business.
Why Market Data Matters for Small Businesses
Large companies spend millions on proprietary research. McKinsey, Gartner, and Forrester charge thousands of dollars per report. But here’s the thing: a significant amount of high-quality market data is available for free, and small business owners who know where to look can access the same insights used by Fortune 500 boardrooms.
Market data helps you answer critical questions:
- Is my industry growing or shrinking?
- Who are the real customers buying in my category?
- What are my competitors doing that I’m not?
- Where is money flowing in my space right now?
- What threats could disrupt my business in the next two years?
Without this context, you’re navigating without a map. With it, you can make product, pricing, hiring, and expansion decisions with real confidence.
Where to Find Free Industry Reports and Market Data
You don’t need a research budget to get good data. Here are the best sources, all free or low-cost.
U.S. Government Sources
The federal government is one of the most underused research tools in small business. The SBA’s market research resources are a solid starting point, but dig deeper into these:
- U.S. Census Bureau (census.gov): Demographic data, income levels, business counts by industry. Invaluable for understanding your local market or sizing a national opportunity.
- Bureau of Labor Statistics (bls.gov): Wage data, industry employment trends, consumer spending reports. If you need to know how much your target customer earns or what they spend on, BLS has it.
- Bureau of Economic Analysis (bea.gov): GDP by industry, regional economic data, consumer spending breakdowns. Great for understanding macro trends affecting your sector.
- USA.gov/data: A portal linking to thousands of datasets from across federal agencies.
Industry Associations
Almost every industry has a trade association that publishes annual reports, trend surveys, and benchmarking data. If you’re in retail, the National Retail Federation publishes detailed consumer reports. If you’re in food service, the National Restaurant Association releases annual industry outlooks. A quick search for “[your industry] association annual report” will surface a wealth of industry-specific data that general sources miss.
Many of these reports are free to members, and membership in a trade association is often deductible as a business expense. Even if you don’t join, executive summaries are usually available at no cost.
Free Research Aggregators
- Statista (statista.com): Aggregates data from hundreds of sources. Many charts are free; premium content is behind a paywall but summaries are often sufficient.
- Think with Google (thinkwithgoogle.com): Consumer behavior trends, search data insights, and industry benchmarks. Excellent for understanding what your customers are searching for and how buying behavior is shifting.
- Pew Research Center (pewresearch.org): Demographics, consumer attitudes, and behavioral trends. Particularly useful if you’re marketing to specific age groups or communities.
- IBISWorld: Industry reports available through many public libraries for free with a library card.
How to Read an Industry Report Without Getting Lost
Industry reports can be dense. A 60-page PDF from a trade association can feel overwhelming. Here’s a practical system for getting what you need fast.
Start With the Executive Summary
The first two to three pages of any quality report will give you the key findings. Read this thoroughly before digging into the full document. It tells you whether the rest of the report is worth your time and flags the most important takeaways.
Focus on Four Numbers
When reviewing market data, zero in on four key metrics:
- Market size: How big is the total opportunity in dollars?
- Growth rate: Is the market expanding, contracting, or flat?
- Customer demographics: Who is actually buying?
- Key drivers and threats: What forces are shaping the industry right now?
These four data points will answer most of your strategic questions and give you enough context to make informed decisions without reading every page.
Look for What’s Changing, Not Just What Is
The most valuable insights come from trend lines, not snapshots. A market that was $2 billion last year and is projected to be $3.5 billion in three years tells you something very different than a static number. Train yourself to look for directional trends: What’s growing? What’s declining? What disruptions are on the horizon?
Turning Data Into Decisions
Reading reports is only half the equation. The other half is knowing how to apply what you learn. Here are four concrete ways to put market data to work.
Validate Your Positioning
Market data can confirm whether your current positioning makes sense or whether you need to shift. If you’re targeting a demographic that industry data shows is declining in purchasing power while another segment is growing rapidly, that’s a signal worth taking seriously. Pair your market data with a structured competitive analysis to understand not just the market, but your specific place in it.
Identify White Space Opportunities
Industry reports often highlight underserved segments, emerging needs, or geographic gaps in coverage. These are your white space opportunities: the places where demand exists but supply hasn’t caught up yet. A savvy business owner who spots a white space through data can move decisively while competitors are still relying on gut feel.
Strengthen Your Pitches and Proposals
When you’re pitching a client, investor, or bank on your business, backing your claims with real market data instantly elevates your credibility. “We believe the demand is there” is weak. “The industry is growing at 12% annually and is projected to reach $8 billion by 2028, according to [credible source]” is compelling. Use data to anchor your narrative in reality.
Benchmark Your Performance
Many industry reports include benchmarking data: average profit margins, revenue per employee, customer acquisition costs, and more. These benchmarks let you measure your own performance against the industry standard. If your margins are below benchmark, you have a target to work toward. If they’re above, you have a competitive advantage worth protecting.
Combine benchmarking with a SWOT analysis to get a complete picture of where you stand and where you have room to grow.
Building a Simple Market Research Routine
You don’t need to spend hours each week on market research. A lightweight routine is all it takes to stay informed without getting buried in data.
- Monthly: Read your industry association’s newsletter or blog. Skim one data source (Think with Google, BLS, or a trade publication) for anything relevant.
- Quarterly: Pull one industry report. Read the executive summary, note the key trends, and ask how they affect your business in the next 90 days.
- Annually: Do a deeper review. Pull benchmarking data, compare your performance, and factor industry trends into your planning for the year ahead.
Keep a running document or folder where you save key stats and report excerpts. Over time, this becomes a personal intelligence database that makes every future decision faster and sharper.
Common Mistakes to Avoid
A few pitfalls trip up business owners who are new to using market data.
- Using outdated data: A 2019 industry report is largely useless in 2026. Always check publication dates and prioritize recent data.
- Confusing national data with local reality: National averages can mask wildly different local conditions. A market that’s growing nationally might be saturated in your specific city. Use local data sources (Census, local chambers of commerce) to ground national trends.
- Treating data as destiny: Data describes patterns and probabilities, not certainties. Use it as one input among many, not as the final word. Pair your data findings with direct customer research. Customer discovery interviews are an excellent complement to the macro picture that industry reports provide.
- Paralysis by analysis: Research is meant to inform action, not replace it. Set a deadline for your research phase and then make the call.
The Bottom Line
The businesses that consistently win aren’t always the ones with the biggest budgets or the most experience. They’re the ones that make better-informed decisions. Industry reports and market data give you the context to see around corners, spot opportunities early, and avoid costly mistakes before you make them.
Start simple. Pick one free resource, spend 30 minutes reading the latest data on your industry, and ask yourself: does this change anything about how I’m running my business? You’ll be surprised how often the answer is yes.
Ready to take your business strategy to the next level? Join Hustler’s Library for free and get access to practical guides, tools, and resources built for entrepreneurs who play to win.
Ready to Know Where You Stand?
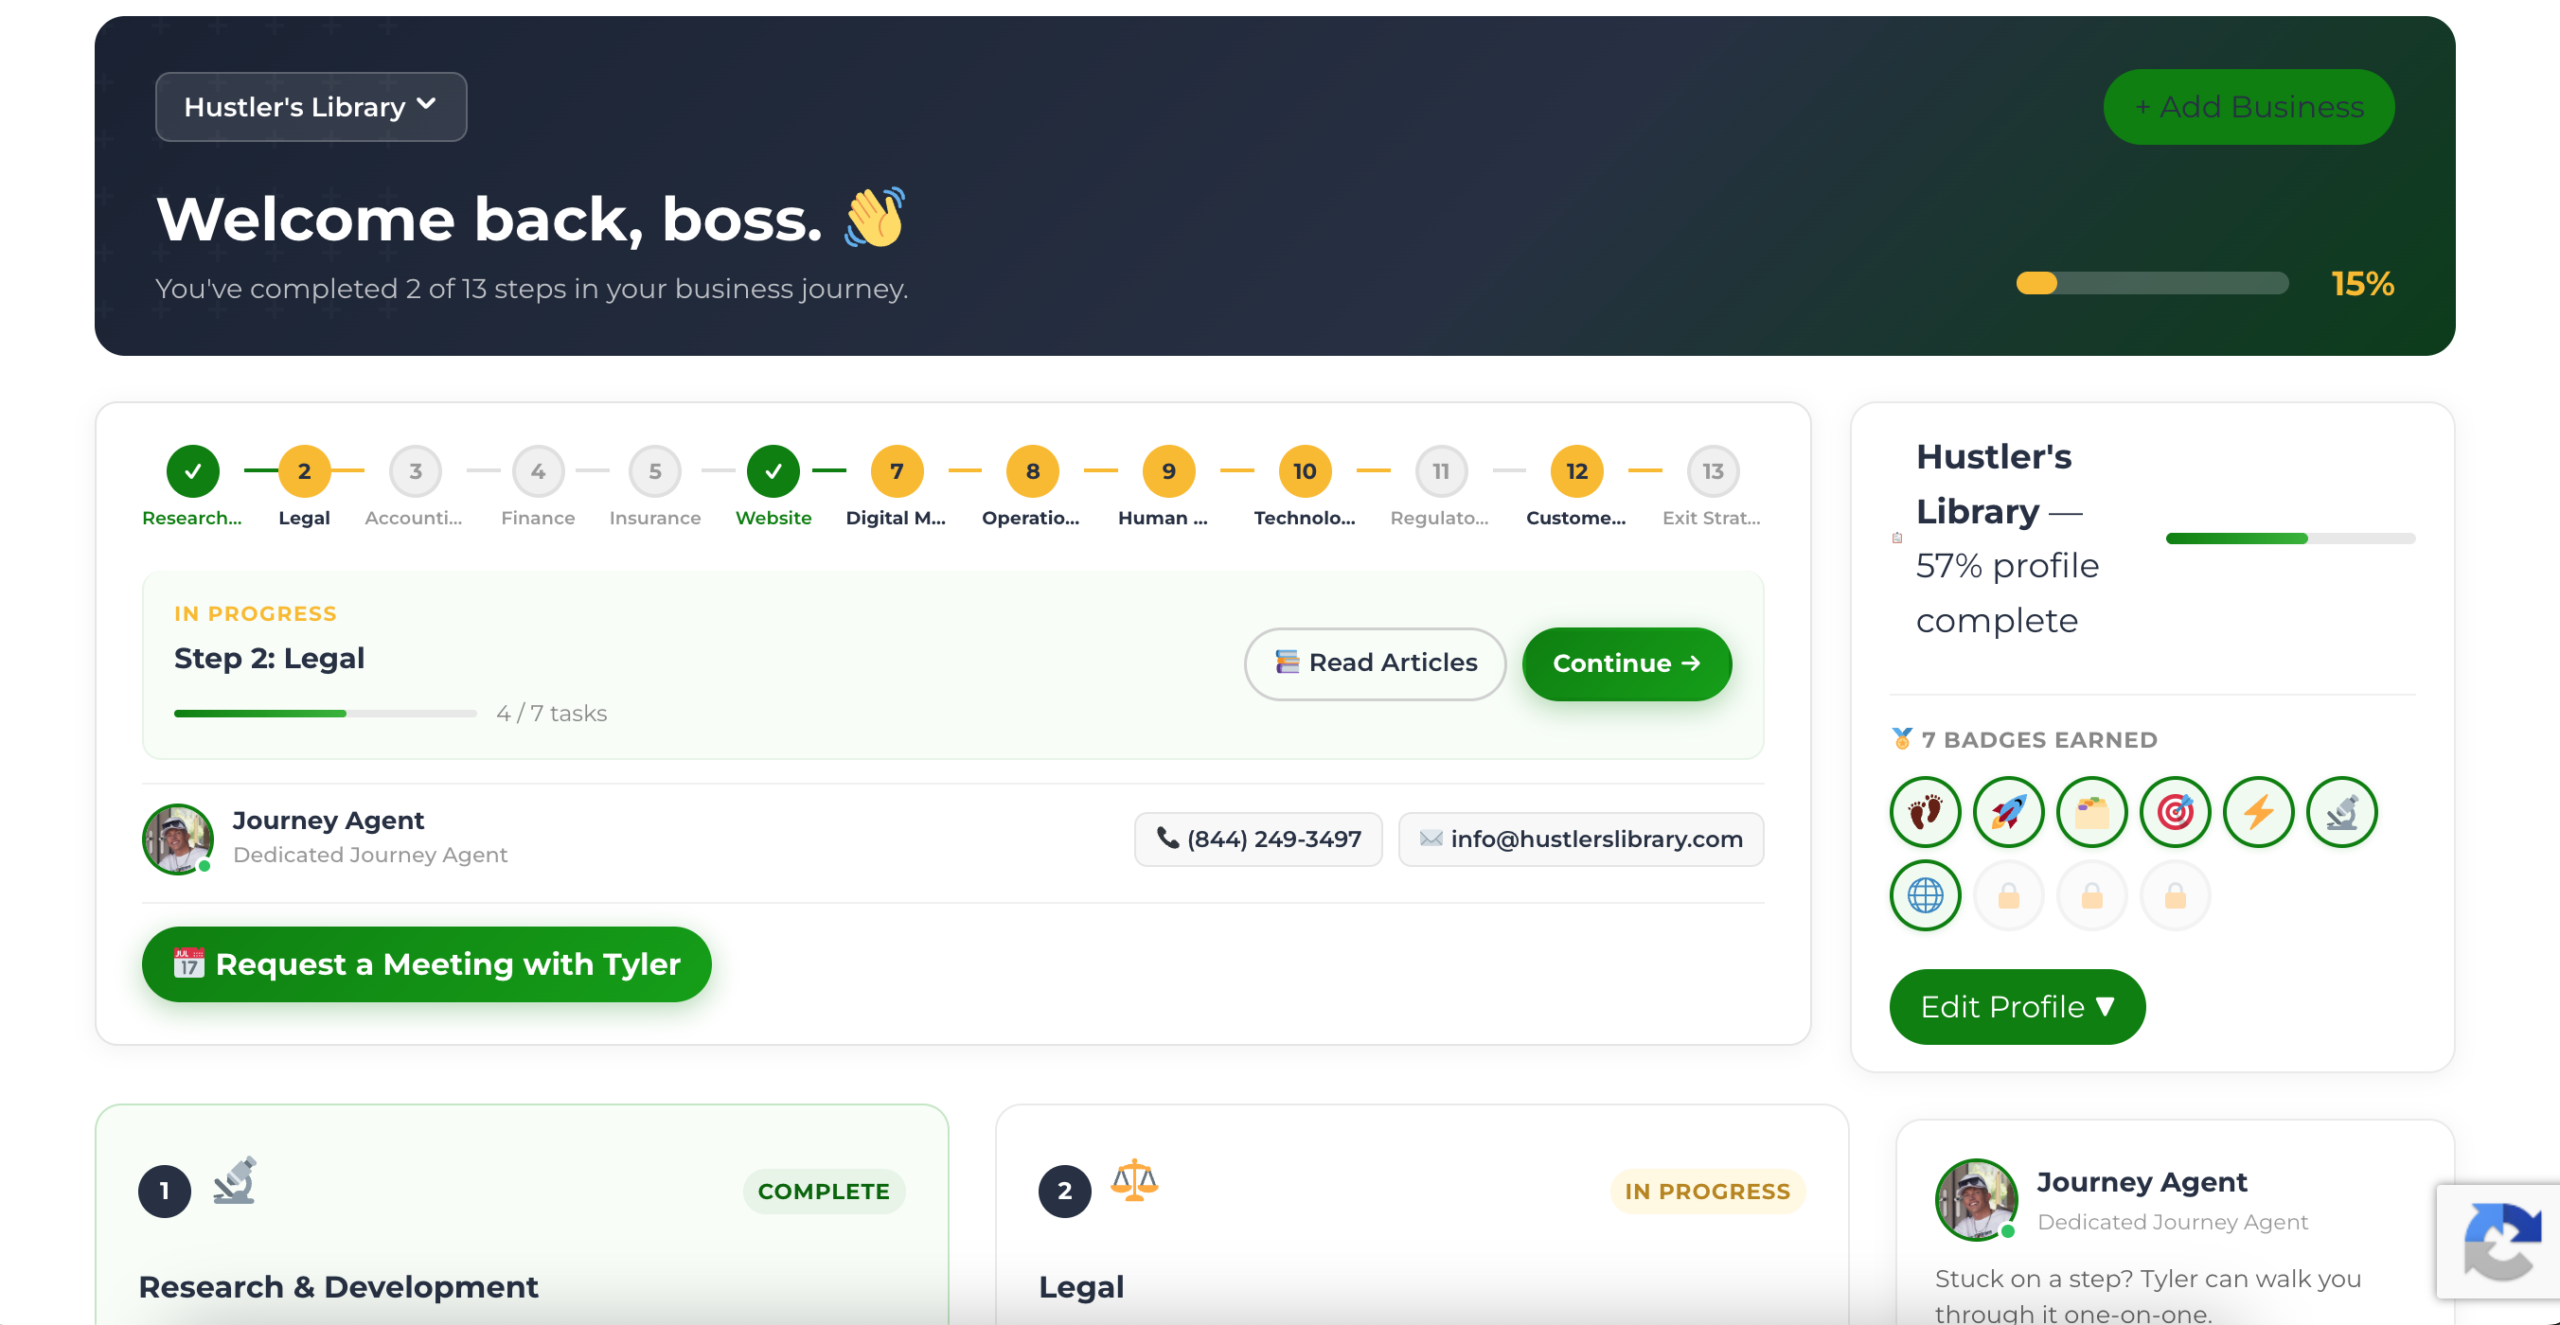
The Business Journey dashboard maps your exact position across all 13 stages. Track your progress, unlock resources for each step, and build with a framework used by thousands of founders at Hustler's Library.
No credit card required · Takes 3 minutes · Personalized to your stage