You built your website. You drive traffic to it. But something is off. People land on your homepage and leave. Your contact form barely gets submissions. Your product page has a high bounce rate but you have no idea why.
The problem is not your product. The problem is that you are flying blind.
That is where heat maps come in. Heat maps are one of the most underused and most powerful tools a small business owner can have. They show you exactly what your visitors are doing on your website: where they click, how far they scroll, and where they get stuck. No guessing. No theories. Just data.
This guide breaks down what heat maps are, how to use them, and the specific changes that will move the needle for your small business website.
What Is a Heat Map?
A heat map is a visual representation of how users interact with a web page. Warmer colors like red and orange show where users engage most. Cooler colors like blue and green show areas with less activity.
There are three main types of heat maps you need to know:
- Click maps show you exactly where users click on your page. You will quickly see whether people are clicking your call-to-action buttons or clicking somewhere completely irrelevant.
- Scroll maps show how far down your page people actually scroll. If your most important content is sitting below the 50 percent scroll line and most visitors never reach it, that is a critical problem.
- Move maps (also called hover maps) track where users move their mouse cursor. Studies show that cursor movement closely mirrors where people are actually reading and looking on a page.
Together, these three views give you a near-complete picture of how visitors experience your website.
Why Heat Maps Matter for Small Business Owners
Most small business owners rely on basic traffic metrics: page views, bounce rate, session duration. Those numbers tell you that something is wrong, but not what or where. Heat maps fill that gap.
Here is a simple example. Imagine you have a services page with three offerings listed. Your click map reveals that 80 percent of visitors click on the first service, almost no one clicks the other two, and a large cluster of clicks is happening on a non-clickable image in the middle of the page. That tells you two things: you may need to reorder your services, and visitors expect that image to be a link.
Without heat maps, you would never know any of that. You would just keep wondering why your services page is not converting.
For small businesses with limited budgets and limited time, heat maps let you focus your energy on changes that are proven to matter rather than changes that just feel right.
How to Get Started With Heat Maps
You do not need to be technical to use heat maps. Several tools offer heat map functionality with simple install processes:
- Hotjar is the most popular option for small businesses. The free tier covers the basics and is enough for most sites under 500 monthly sessions. Paid plans start around $32 per month.
- Microsoft Clarity is completely free and includes heat maps, session recordings, and basic analytics. It is a strong choice if budget is tight.
- Lucky Orange combines heat maps with live visitor tracking and form analytics. Plans start around $19 per month.
- Crazy Egg was one of the originals and includes a solid A/B testing feature alongside heat maps. Plans start around $29 per month.
Most of these tools require you to paste a small snippet of JavaScript code onto your website, or install a plugin if you are running WordPress. The setup typically takes under 20 minutes.
What Pages to Analyze First
You do not need heat maps on every page. Start with the pages where user behavior matters most:
- Homepage: This is usually your highest-traffic page. A heat map will tell you whether visitors understand your value proposition, whether they find your navigation, and whether they are clicking toward conversion.
- Services or Products page: Where are people clicking? What are they ignoring? Are they reaching the pricing or the contact button?
- Contact or booking page: Are people dropping off the form partway through? Are they clicking on fields that are confusing them?
- Your highest-traffic landing page: If you are running any paid ads or promotion, the landing page needs to convert. Heat maps will show you exactly where it is failing.
Once you have collected a few hundred sessions of data, the patterns will become obvious. Give it at least one to two weeks before drawing conclusions.
Common Problems Heat Maps Reveal (And How to Fix Them)
Problem 1: Nobody Is Scrolling Past the Fold
If your scroll map shows a sharp drop at the top of the page, visitors are not seeing the rest of your content. The fix: move your most persuasive content, your headline, your main value offer, and your primary call to action above the fold. Do not bury them.
Problem 2: People Are Clicking on Things That Are Not Links
This is called “rage clicking” and it shows up in heat maps as a hot cluster of clicks on a non-interactive element. If users expect something to be clickable and it is not, they get frustrated and leave. The fix: either make that element a link, or redesign it so it does not look like a button or link.
Problem 3: Your Call to Action Is Getting Ignored
If your click map shows barely any activity on your main CTA button, it is likely invisible to users. The fix: check the placement, contrast, and copy on your CTA. Move it higher on the page. Make the button color contrast sharply with the background. Replace vague text like “Submit” with action-oriented text like “Get My Free Quote.”
Problem 4: Your Navigation Is Pulling Attention Away From Conversions
If your click map shows most clicks going to secondary menu items rather than conversion actions, your navigation may be doing more harm than good. On dedicated landing pages, consider removing the navigation entirely to reduce distraction. You can learn more about this in our guide on how to build a high-converting landing page for your small business.
Problem 5: Mobile and Desktop Users Behave Differently
Most heat map tools let you filter by device type. This is critical. A layout that works beautifully on desktop may be completely broken on mobile. Check both separately and treat them as two different pages when making improvements.
How Heat Maps Connect to Your Broader Marketing Strategy
Heat maps are most powerful when you use them alongside other data. Pair your heat map findings with conversion rate data to prioritize fixes. If a page has high traffic but low conversion and your heat map shows that users are not reaching your CTA, that is a high-priority fix. For a deeper look at measuring and improving conversion metrics, see our guide on how to track and improve your small business conversion rate.
You can also use predictive analytics alongside heat maps to understand not just what is happening on your site today, but what patterns are likely to continue. Together, these tools turn your website from a guessing game into a growth engine.
A Simple 4-Step Heat Map Process for Small Business Owners
Here is how to build heat map analysis into a regular habit without it taking over your schedule:
- Install a heat map tool on your top 3 to 5 highest-traffic pages.
- Collect at least 500 sessions before reviewing results (or two to four weeks of data, whichever comes first).
- Identify your top three issues using click, scroll, and move maps. Focus on patterns, not individual sessions.
- Make one change at a time and observe the impact. Changing multiple things at once makes it impossible to know what worked.
The SBA recommends that small businesses review their digital marketing performance regularly as part of a broader growth strategy. Heat maps are one of the most direct ways to do that. You can explore more of the SBA’s small business digital resources at sba.gov.
The Bottom Line
Most small business websites are leaving money on the table. Not because the product is bad or the traffic is wrong, but because no one has ever looked at what visitors actually do once they arrive.
Heat maps fix that. They take the guesswork out of website optimization and replace it with clear, visual evidence. You will see exactly where people engage, where they drop off, and what changes will make the biggest difference.
Start with a free tool like Microsoft Clarity. Set it up this week. Let it run for two weeks. Then look at what it shows you. I can almost guarantee you will find at least one thing that surprises you and one change that immediately improves your results.
If you want more tools, strategies, and plain-English guides to running a smarter small business, join the Hustler’s Library for free. We break down what actually works so you can spend less time guessing and more time growing.
Ready to Know Where You Stand?
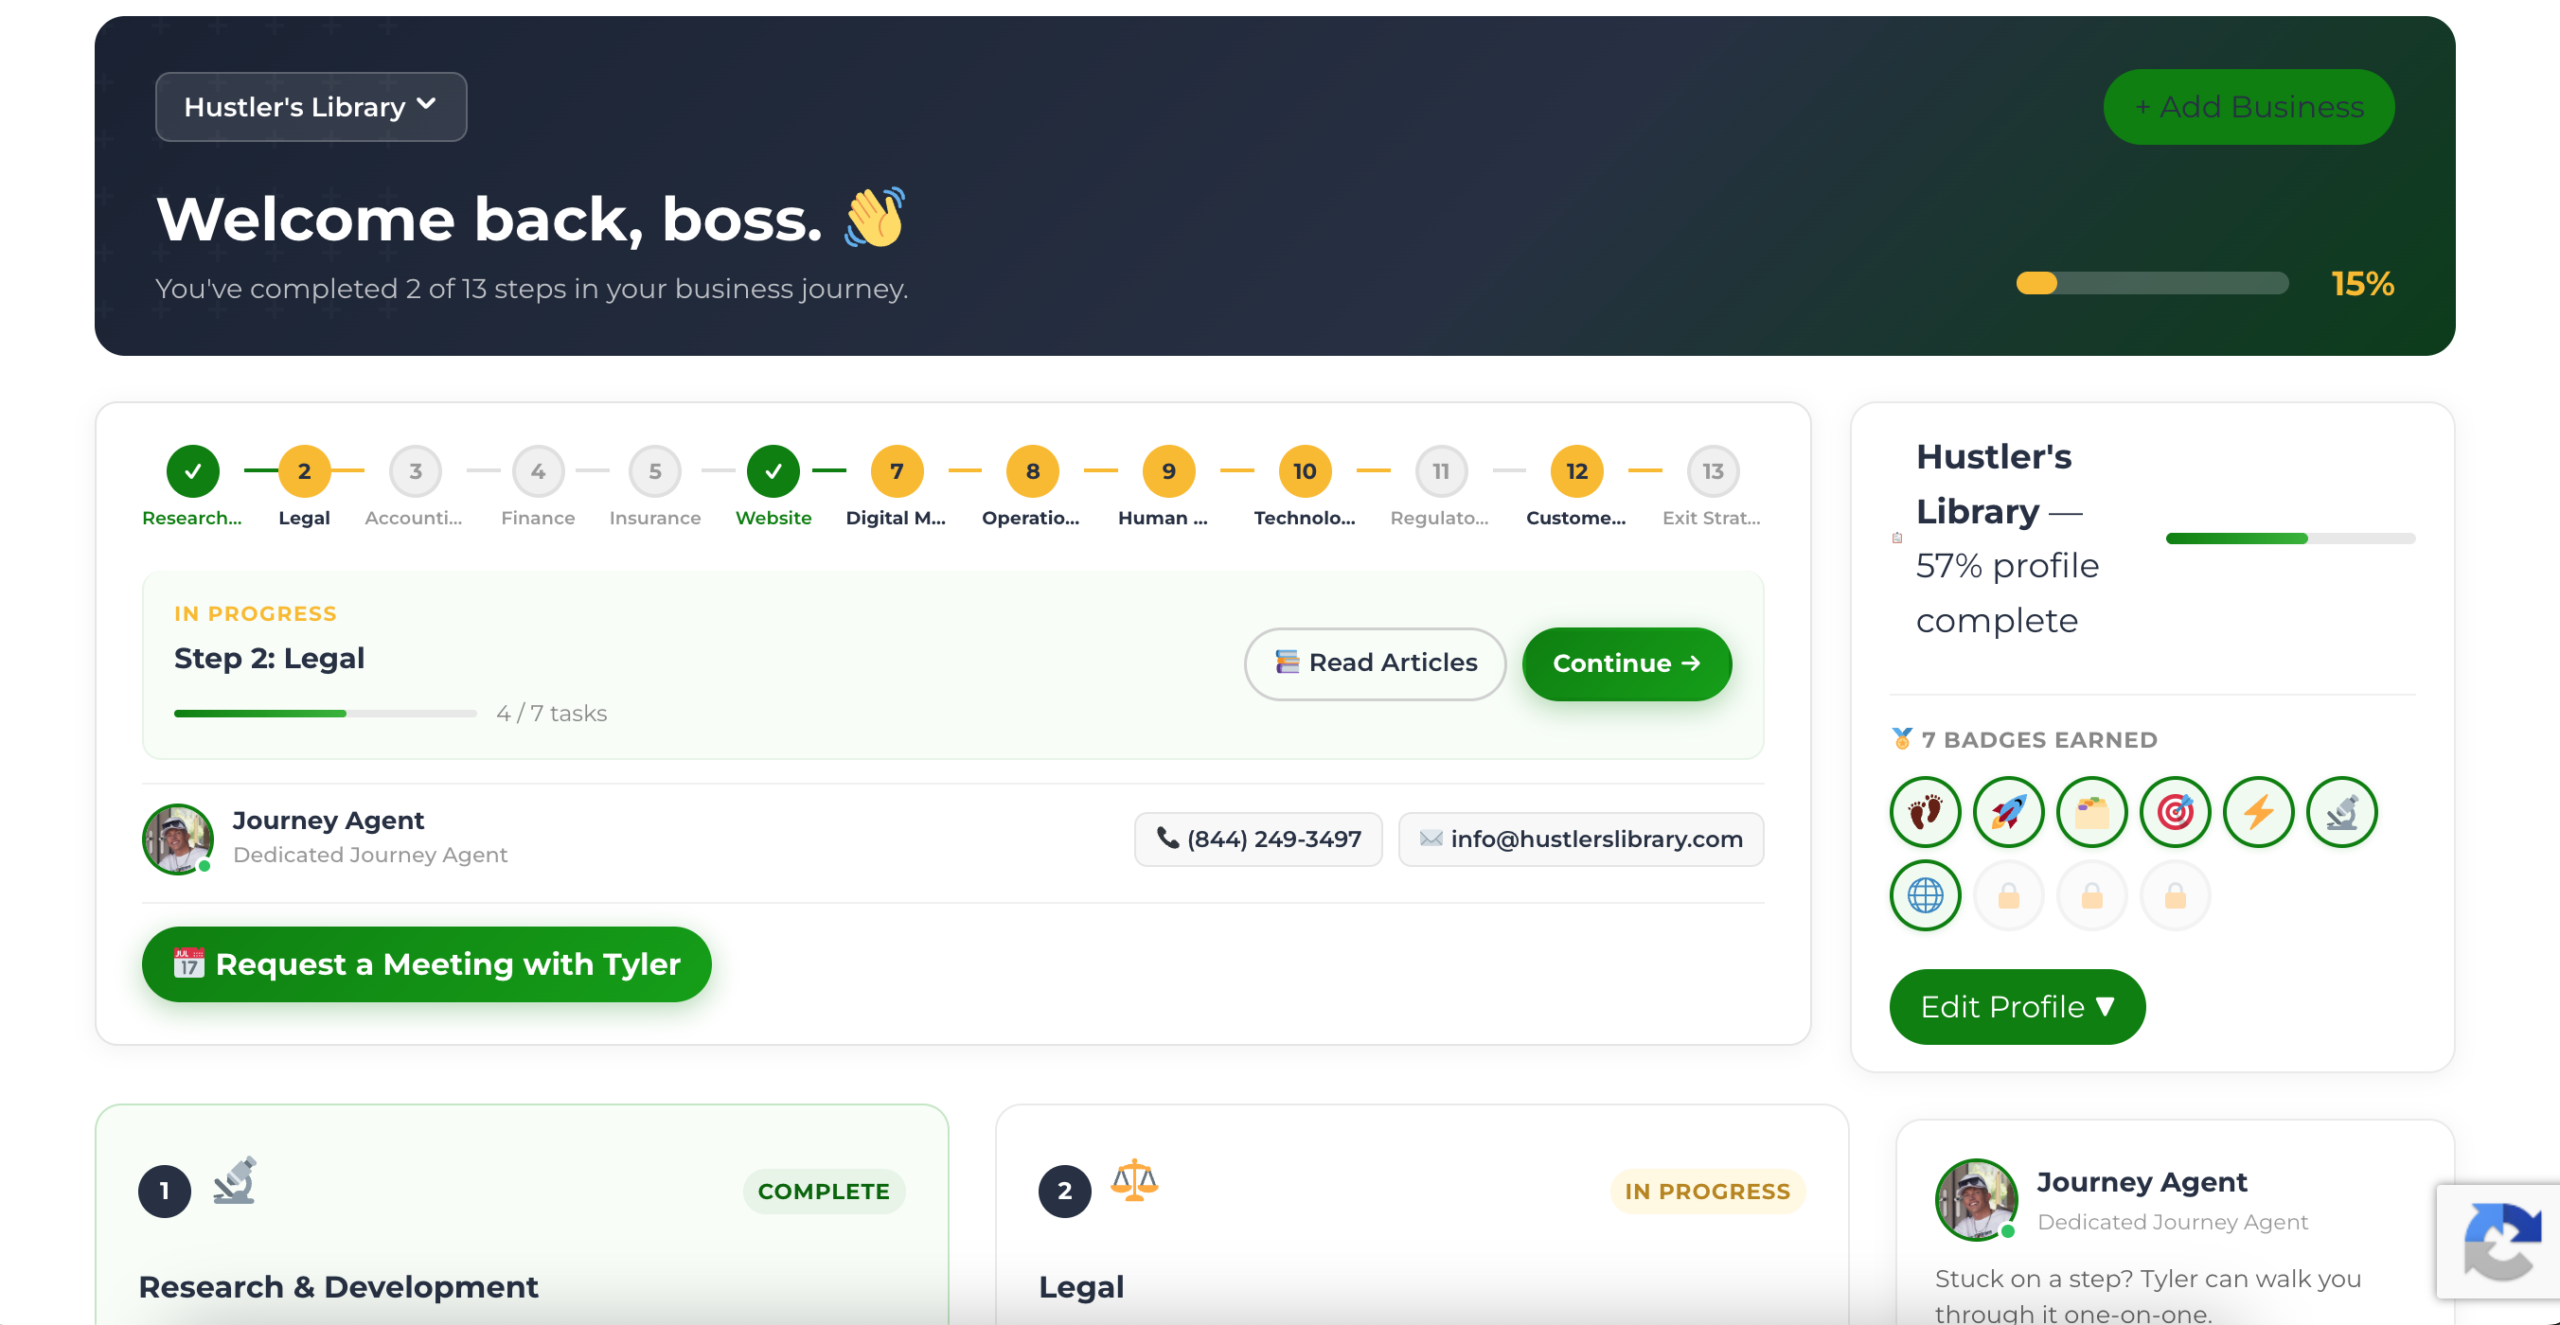
The Business Journey dashboard maps your exact position across all 13 stages. Track your progress, unlock resources for each step, and build with a framework used by thousands of founders at Hustler's Library.
No credit card required · Takes 3 minutes · Personalized to your stage