

Most small business owners are busy. Too busy, in fact, to stop and ask a question that could completely change their financial picture: Which of the things I sell actually makes me money?
Not all products and services are created equal. Some bring in solid revenue and even better margins. Others eat your time, drain your team, and quietly underperform. The problem is, most owners treat everything on their menu the same way because they have never taken the time to look.
That changes today. Here is how to identify your most profitable products and services, and what to do with what you find.
Why This Analysis Matters More Than You Think
It is tempting to focus on total revenue as a measure of business health. But revenue without context is just noise. A product that brings in $10,000 a month but costs $9,500 to deliver is not a winner. A service that generates $3,000 a month but takes two hours to fulfill is a goldmine.
Profitability analysis gives you the real picture. It tells you where your effort is being rewarded and where it is being wasted. Once you know that, you can make smarter decisions about where to focus, what to promote, what to cut, and how to grow.
Many business owners who do this exercise for the first time are surprised to discover that 20 percent of what they offer drives 80 percent of their actual profit. That is not just a cliche. It is the reality for a huge number of small businesses.
Step 1: Pull Your Revenue by Product or Service
Start with the basics. Break down your total revenue by individual product or service line for the past 12 months. Your accounting software, point-of-sale system, or invoicing platform should be able to generate this report.
If you run a service business, sort your revenue by service type. If you sell physical products, sort by SKU or product category. If you offer a mix of both, keep them separate.
Do not average things together or look at departments broadly. You want granular data. The more specific you can get, the more useful this exercise will be.
Step 2: Calculate the True Cost of Each Offering
Revenue is only half the story. Now you need to figure out what it actually costs to deliver each product or service.
For products, this includes cost of goods sold, packaging, shipping, storage, and any labor involved in getting the product out the door. For services, this includes labor time (use an hourly rate for yourself and any staff involved), software or tools used, and any direct expenses tied to delivery.
Here is where many owners get tripped up: they forget to factor in their own time. If you are the one delivering a service that takes eight hours and you value your time at $75 an hour, that service costs you $600 in labor before anything else. That needs to be in the math.
You also want to consider what economists call opportunity cost. Every hour you spend on a low-margin offering is an hour you are not spending on a high-margin one. That invisible cost matters.
Step 3: Calculate Gross Margin for Each Line
Once you have revenue and direct costs, the formula is simple:
Gross Margin = (Revenue – Direct Costs) / Revenue x 100
A product that brings in $5,000 and costs $2,000 to deliver has a gross margin of 60 percent. A service that generates $4,000 and costs $3,200 to deliver has a gross margin of 20 percent. Same ballpark in revenue, dramatically different in profitability.
Run this calculation for every product and service you offer. Then rank them from highest to lowest margin. What you find will likely surprise you.
Step 4: Layer In Volume and Time
Margin alone does not tell the whole story. You also need to consider volume and time investment.
A service with a 70 percent margin that you can only sell twice a month is not as powerful as one with a 45 percent margin that you sell 20 times a month. Look at total profit contribution, not just margin percentage.
Time is the other factor. Some offerings are margin-positive but time-intensive in ways that do not show up in a spreadsheet. If a particular service line requires heavy customization, frequent client communication, or ongoing troubleshooting, that time cost eats into real-world profitability even if the numbers look good on paper.
A useful exercise: calculate your effective hourly rate for each offering. Divide the gross profit by the number of hours required to deliver it. This gives you a true sense of what your time is worth on each product or service.
Step 5: Identify Your Stars and Your Dogs
Now you have enough data to put everything into one of four buckets:
- Stars: High margin, high volume, manageable time. These are your core offerings. Protect them, optimize them, and double down on selling them.
- Question marks: High margin but low volume. These have potential. Ask why they are not selling more and whether it is a marketing problem you can solve.
- Cash cows: Lower margin but high volume and reliable. These keep the lights on. Do not neglect them, but be cautious about investing more time in growing them.
- Dogs: Low margin, low volume, high hassle. These are the offerings you should seriously consider cutting or restructuring. Every business has at least one.
This framework is loosely adapted from the BCG Matrix, a classic strategic tool. The point is not rigid categorization. It is giving you a clear-eyed view of where your portfolio actually stands.
Step 6: Use the Data to Make Real Decisions
The whole point of this analysis is to act on what you learn. Here are the most common actions small business owners take after doing this exercise:
Cut or restructure low-profit offerings. If something consistently underperforms and does not serve a strategic purpose, it is costing you more than it is giving you. Consider discontinuing it, raising its price, or restructuring delivery to reduce your cost.
Raise prices on high-demand, high-margin work. If customers are buying something eagerly and it already has strong margins, that is a signal the market values it. Test a price increase. You might be pleasantly surprised by the results. For more on this approach, see our guide to value-based pricing.
Shift your marketing focus. Stop promoting your dogs and start promoting your stars. Your marketing budget and attention should follow your most profitable products and services, not your entire catalog equally.
Use it to guide hiring and capacity decisions. If you know which offerings drive the most profit, you can make smarter decisions about where to add capacity. Hire to support your stars, not your dogs.
Step 7: Watch for Hidden Revenue Leaks
While you are doing this analysis, keep an eye out for patterns that signal revenue is slipping through the cracks. Are certain products being discounted frequently? Are some clients consistently negotiating your rates down on specific services? Are there offerings you price inconsistently?
Each of these patterns chips away at your actual profitability in ways that do not show up in a simple revenue report. For a deeper look at where money quietly disappears in a small business, check out our guide on identifying and fixing revenue leaks.
How Often Should You Do This?
Quarterly is ideal for most small businesses. Annual at minimum. The goal is to make profitability analysis a regular habit, not a one-time event.
Markets shift. Costs change. What was a star last year can become a dog this year if input costs rise or competition intensifies. Staying on top of your numbers means you catch those shifts early, while you still have room to respond.
If you want to take this further and start modeling future scenarios based on your profitability data, our guide to financial modeling for small businesses is a natural next step.
A Note on Getting Help
If you have been operating without detailed cost tracking, this exercise can feel overwhelming. That is normal. Start with your top five revenue generators and work from there. You do not need a perfect picture on day one. You need enough information to make better decisions than you were making yesterday.
If your books are not clean enough to do this analysis confidently, it may be time to bring in a bookkeeper or accountant. The cost is almost always worth it. Businesses that operate with clear financial visibility consistently outperform those that do not. The SBA’s finance management resources are also a solid free starting point if you want to build your own financial literacy first.
The Bottom Line
Your most profitable products and services are probably already in your business. You just have not identified them clearly enough to treat them the way they deserve. Run the numbers, rank your offerings honestly, and then do something about what you find.
The businesses that grow fastest are not the ones that do the most. They are the ones that do the right things most. Knowing where your profit actually comes from is the first step to doing exactly that.
Ready to take your business to the next level? Join the Hustler’s Library community for free and get access to tools, guides, and resources built for real business owners. Join free here.
Ready to Know Where You Stand?
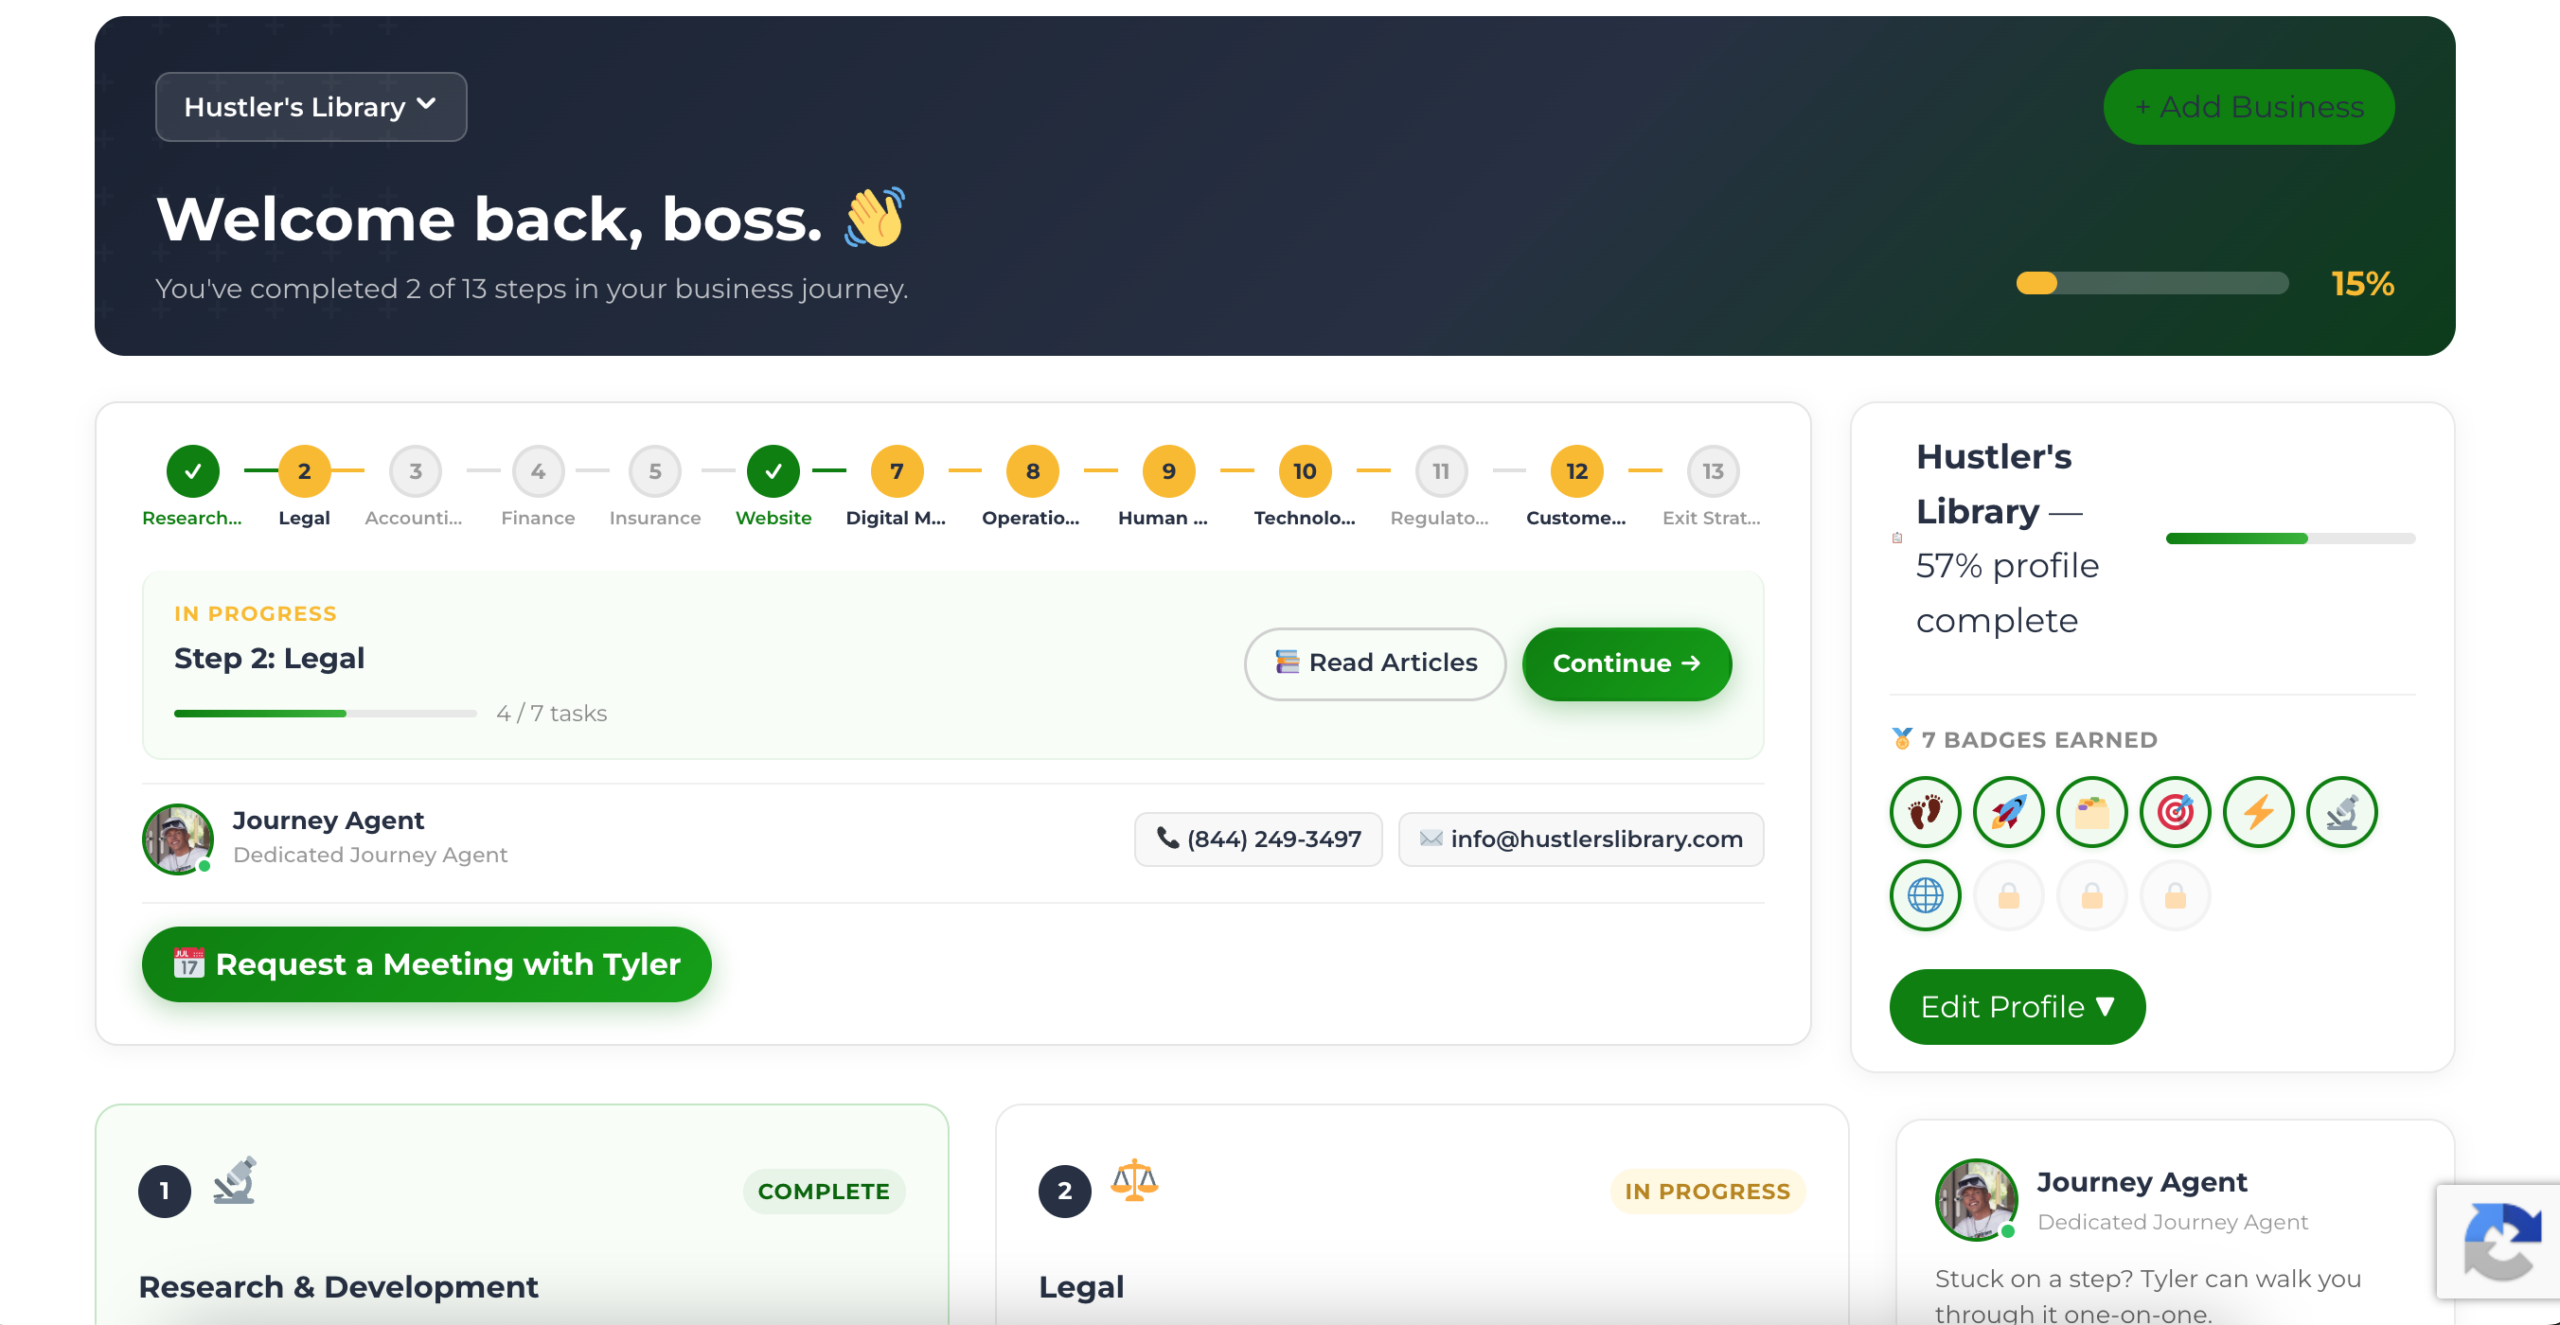
The Business Journey dashboard maps your exact position across all 13 stages. Track your progress, unlock resources for each step, and build with a framework used by thousands of founders at Hustler's Library.
No credit card required · Takes 3 minutes · Personalized to your stage