

Most small business owners know they should be tracking numbers. And most of them are. The problem is they’re tracking the wrong ones.
Revenue is the most common obsession. It’s the number that gets bragged about at networking events and plastered on social media. But revenue without context is almost meaningless. A business doing $2 million a year with 4% margins and no cash reserves is in a far more precarious position than one doing $400,000 a year with 35% margins and six months of operating costs in the bank.
The metrics that actually predict whether your business will still be standing in three, five, or ten years are quieter. They don’t make for flashy Instagram captions. But the owners who pay attention to them sleep better, make smarter decisions, and build businesses that last.
Here are the five metrics that matter most and what each one is telling you about the health of your business.
1. Gross Profit Margin
Before you can build anything sustainable, you need to understand how much money you actually keep from every dollar of revenue after you subtract the direct costs of delivering your product or service.
Gross profit margin = (Revenue – Cost of Goods Sold) / Revenue x 100
If you’re a service business charging $10,000 for a project and it costs you $4,000 in labor and materials to deliver it, your gross margin is 60%. That sounds healthy. But if it’s only 20%, you’re going to struggle to cover overhead, let alone build real profit.
What makes gross margin so predictive is that it sets the ceiling for everything else. You can’t cut your way to profitability below a healthy gross margin. If you’re constantly grinding to make the numbers work, this is usually where the problem lives.
Benchmarks vary by industry. Retail businesses might aim for 40 to 50%. Service businesses should generally target 60% or higher. Software companies often run at 70 to 80%. Knowing your industry standard gives you a real baseline to compare against.
2. Customer Acquisition Cost (CAC)
How much does it cost you to bring in a new customer? This number includes your marketing spend, sales time, advertising costs, referral fees, and any other expenses directly tied to winning new business.
CAC = Total sales and marketing spend / Number of new customers acquired
Many small business owners have no idea what their CAC is. They run ads, do events, post on social media, and whatever comes in comes in. That’s a strategy for guessing, not growing.
Once you know your CAC, you can make real decisions. If it costs you $500 to acquire a customer who spends $600 with you once and never comes back, you’re barely breaking even after overhead. If that same customer spends $600 a month for two years, the economics look completely different.
CAC only makes sense in relationship to your next metric.
3. Customer Lifetime Value (CLV)
Customer lifetime value is the total revenue you can expect from a single customer over the entire relationship. It’s the metric that tells you how much you can afford to spend to acquire that customer in the first place.
CLV = Average purchase value x Purchase frequency x Average customer lifespan
The general rule of thumb is that your CLV should be at least three times your CAC. If it’s lower, you’re in a dangerous position where growth actually costs you money. If it’s five to ten times higher, you have real room to invest in marketing and scale.
The reason CLV is such a powerful predictor of success is that it forces you to think beyond the first transaction. Businesses that optimize for the first sale stay small. Businesses that optimize for the full relationship build something durable.
If you want a deeper look at how to improve this number, our guide on the 7 numbers every small business owner should track every week walks through the interconnections between these figures in practical terms.
4. Net Profit Margin
This is the bottom line. After you’ve paid for everything: cost of goods, rent, payroll, software, taxes, and every other expense, what percentage of revenue is left over as actual profit?
Net profit margin = Net income / Revenue x 100
A lot of busy-looking businesses have terrible net margins. They have high revenue, lots of employees, and full calendars. They also have almost nothing left at the end of the month. This is the trap that catches owners who optimize for growth before they’ve optimized for efficiency.
What constitutes a healthy net margin depends heavily on your industry. Restaurants often run 3 to 9%. Professional services might target 15 to 25%. Software businesses can reach 20 to 40%. But regardless of your industry, a declining net margin over time is one of the clearest warning signs a business is heading for trouble.
We covered this metric in depth in our post on net profit margin and what it really tells you about your business’s health. If you haven’t read it yet, it’s worth your time.
5. Monthly Recurring Revenue (MRR) or Revenue Predictability
Not every business has a subscription model, but every business benefits from understanding how predictable its revenue is. For subscription businesses, this means tracking MRR directly. For project-based or transactional businesses, it means tracking the percentage of revenue that comes from repeat customers versus new ones.
Revenue predictability is a proxy for business stability. The more of your revenue you can reliably count on each month without starting from zero, the less time you spend in survival mode and the more you can invest in strategic growth.
If more than 70% of your revenue comes from repeat customers or locked-in contracts, your business has a foundation. If you’re starting from scratch every single month, chasing new clients to pay your bills, you don’t have a business so much as a very stressful job.
This is why the most experienced business advisors consistently push owners toward retainers, maintenance contracts, memberships, and subscription tiers. It’s not just about revenue. It’s about the kind of revenue that lets you plan, invest, and sleep.
Why Most Owners Track the Wrong Things
Revenue is easy to see and satisfying to watch go up. Social media followers, website visits, and email open rates all feel like progress because they’re visible and they move. But visibility and importance are not the same thing.
The metrics that actually predict business success tend to be slower moving and less glamorous. Gross margin doesn’t spike overnight. Customer lifetime value takes months or years to calculate meaningfully. Net profit margin requires you to face the full picture of your costs, which is uncomfortable for most owners.
The SBA consistently reports that cash flow problems and weak profitability are among the leading causes of small business failure. Not lack of ambition. Not bad products. Not poor marketing. The numbers simply didn’t add up, and the owners either didn’t know it or knew it too late.
The fix isn’t complicated. You don’t need a finance degree or expensive software. You need to pick the right five or six numbers, understand what they mean, and review them consistently. Our guide on how to use financial ratios to run a smarter small business is a strong next step if you want to go deeper.
How to Start Using These Metrics Today
You don’t have to overhaul your entire financial system to make progress. Start with this:
- Pull your last three months of revenue and direct costs. Calculate your gross margin.
- Estimate what you spent on sales and marketing last quarter and how many new customers came in. That’s your CAC.
- Look at your top ten customers. Calculate roughly how much each has spent over their lifetime. Average it. That’s your CLV baseline.
- Look at your last full month’s income and expenses. Calculate your net margin.
- Look at this month’s revenue and identify how much came from returning customers versus new ones.
None of that requires a CFO. It requires an hour, a spreadsheet, and the willingness to face the real numbers instead of the ones that feel good.
The businesses that last aren’t necessarily the ones with the biggest revenue or the most impressive growth stories. They’re the ones run by owners who understood the numbers that actually mattered and made decisions accordingly.
Track the right things. Everything else follows.
Want more tools and strategies for building a smarter, more profitable business? Join Hustler’s Library for free and get access to our full resource library built for serious small business owners.
Ready to Know Where You Stand?
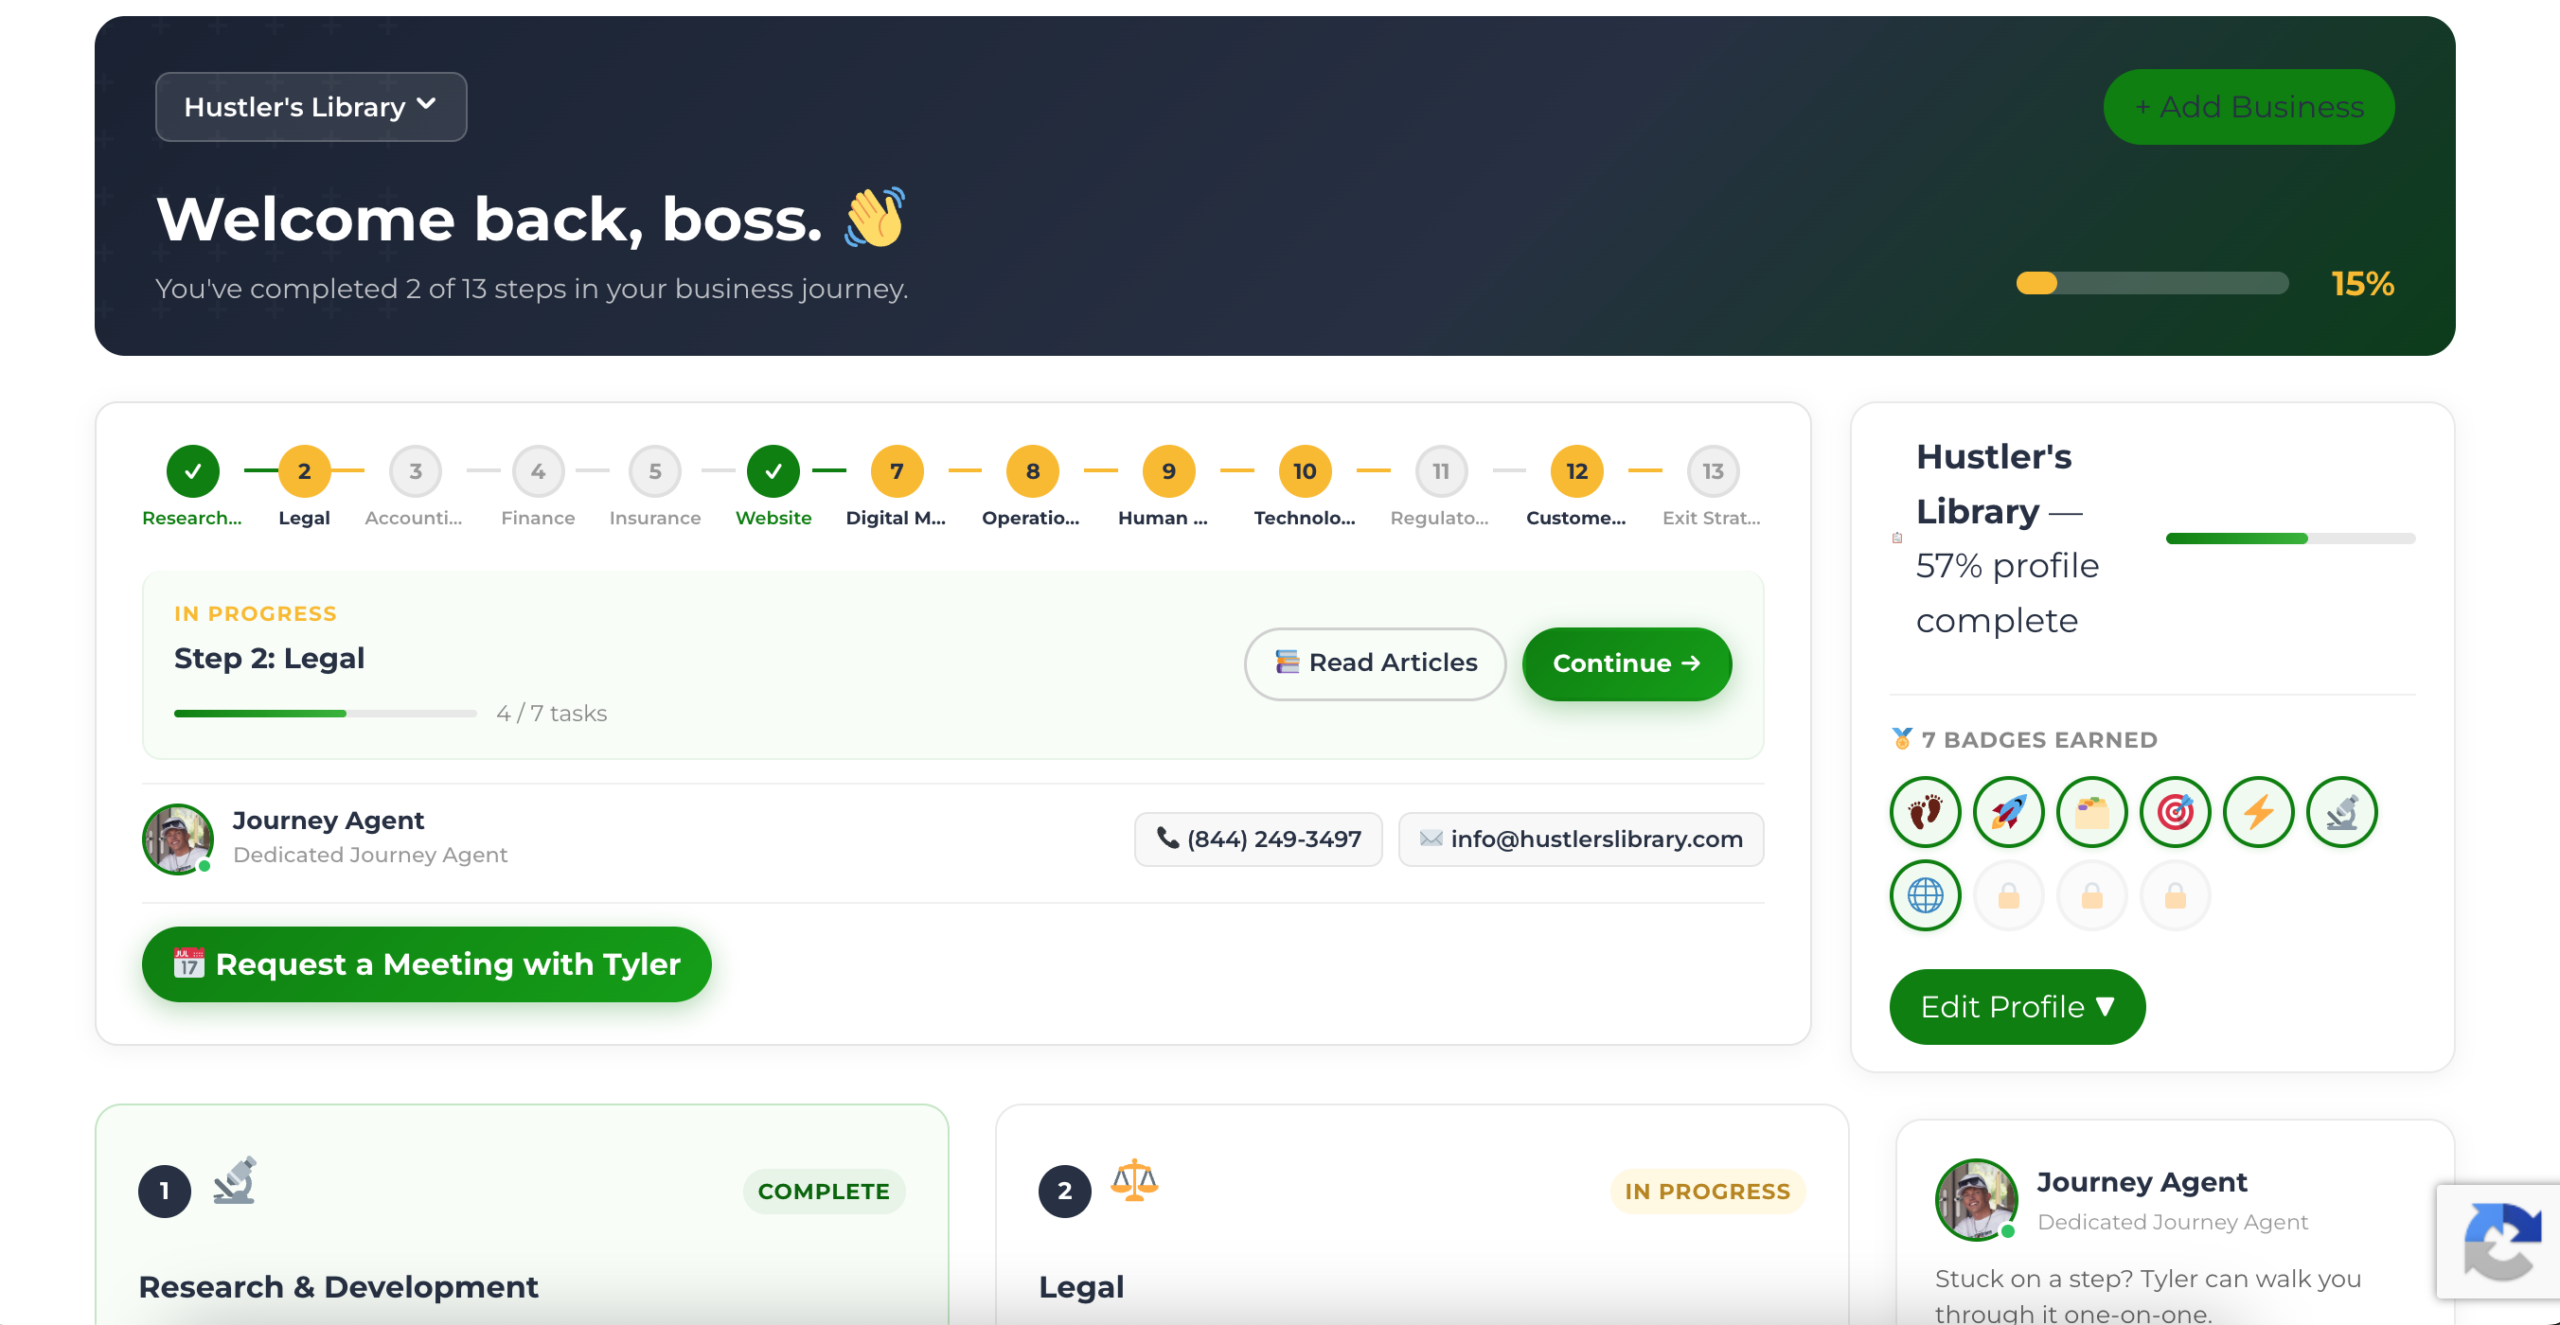
The Business Journey dashboard maps your exact position across all 13 stages. Track your progress, unlock resources for each step, and build with a framework used by thousands of founders at Hustler's Library.
No credit card required · Takes 3 minutes · Personalized to your stage