

Every business collects metrics. Revenue, churn, conversion rate, open rate. Most of these metrics tell you what already happened. NPS tells you what is about to happen. It is a leading indicator of growth or decline, wrapped in a single question and a single number.
Companies that take NPS seriously tend to grow. Companies that ignore it tend to wonder why their acquisition spend stops working.
What Is NPS?
Net Promoter Score (NPS) is a customer loyalty metric based on one question: “On a scale of 0 to 10, how likely are you to recommend this company to a friend or colleague?” Developed by Fred Reichheld and Bain and Company in 2003, it has become the most widely used customer experience metric in business.
The concept is simple: people who love your product tell others. People who had a bad experience also tell others. NPS attempts to quantify the balance between those two forces.
The Three Groups: Promoters, Passives, Detractors
Promoters (Score 9-10)
Promoters are your most loyal customers. They actively recommend your business to others without being asked. They are less price-sensitive, more forgiving of occasional errors, and significantly more valuable over their lifetime than average customers. Research shows Promoters have 2-3x higher LTV than Detractors at the same company.
Passives (Score 7-8)
Passives are satisfied but not enthusiastic. They are unlikely to actively refer, and they are vulnerable to competitive offers. They do not hurt your NPS calculation, but they represent untapped potential. Converting Passives to Promoters is often the highest-ROI NPS improvement activity.
Detractors (Score 0-6)
Detractors are customers who had an experience bad enough that they may actively warn others away from your business. Research shows that unhappy customers tell an average of 9-15 people about their negative experience. In the social media era, that number can be exponentially higher.
Detractors do not just fail to grow your business. They actively shrink it.
The Calculation
NPS = % Promoters minus % Detractors. Passives are excluded from the calculation.
If 60% of respondents are Promoters and 15% are Detractors, your NPS is 45. Scores range from -100 (everyone is a Detractor) to +100 (everyone is a Promoter).
Why Word-of-Mouth Is Still the Highest-Converting Acquisition Channel
Paid advertising gets less efficient every year. Privacy changes, platform saturation, and ad fatigue all push CAC higher over time. Word-of-mouth does the opposite. A referred customer converts at 2-5x the rate of a cold acquisition, has a 16-25% higher LTV, and costs effectively nothing to acquire beyond the goodwill of the customer who referred them.
This is why NPS is a growth metric, not just a satisfaction metric. A rising NPS means your word-of-mouth engine is getting stronger. A falling NPS means you are quietly burning the most valuable acquisition channel you have.
How Chewy, Apple, and Costco Obsess Over NPS
Chewy: Turn Detractors Into Fans Through Individual Moments
Chewy consistently earns NPS scores above 70 in the pet care category. Their secret is not the product: they sell the same pet food and supplies you can get on Amazon. Their secret is the service experience, specifically the moments that generate genuine surprise.
When customers report that a pet has died, Chewy regularly sends hand-written condolence cards and sometimes flowers. These gestures cost almost nothing relative to the word-of-mouth they generate. A grieving pet owner who receives that card does not just stay a customer; they become an evangelist. Stories about Chewy’s customer service circulate on social media constantly and organically. That is NPS in action at the product experience level.
Apple: Consistency Across Every Touchpoint
Apple’s retail NPS consistently ranks among the highest in the technology sector. The reason is not the products alone; it is the end-to-end consistency of the experience. The in-store Genius Bar, the unboxing experience, the customer service protocols, and the product design all communicate the same message. When every touchpoint delivers, there are fewer moments to generate Detractors and more moments to generate Promoters.
Costco: The Membership Creates Psychological Commitment
Costco’s NPS consistently sits in the 70-80 range, extraordinarily high for retail. The membership fee is part of why. Customers who paid to belong are cognitively invested in the value of the relationship. They are primed to look for confirmation that they made a good decision. This is not manipulation; it is structural alignment between the business model and customer psychology. Read the full breakdown: How Costco Turned a Membership Fee Into a Loyalty Machine.
What a Good NPS Score Looks Like by Industry
NPS is benchmarked against industry peers, not an absolute scale. A score of 40 might be excellent in banking and mediocre in software.
- Technology / SaaS: Average 35-45. Leaders: 60+
- Retail / E-commerce: Average 45-55. Leaders: 70+
- Financial Services: Average 25-35. Leaders: 50+
- Healthcare: Average 20-30. Leaders: 45+
- Hospitality: Average 50-60. Leaders: 75+
- Cable / Telecom: Average 0-20. Most customers are trapped, not loyal.
Context matters. If you are in financial services with an NPS of 50, you are likely winning your category. If you are in hospitality with the same score, you are at the industry median.
How to Measure NPS Cheaply
You do not need enterprise software to run NPS. The minimum viable implementation:
- Use a free tool like Typeform, Google Forms, or SurveyMonkey to build a one-question survey.
- Send it via email to customers 7-14 days after their first purchase or after a key milestone (subscription renewal, service delivery, etc.).
- Add an open-text follow-up: “What is the main reason for your score?” This qualitative data is often more actionable than the number itself.
- Calculate your NPS manually in a spreadsheet: count Promoters, Detractors, and divide each by total respondents. Subtract.
- Run it quarterly to track trends. A single NPS is a snapshot. Trends over time are the signal.
For growing teams managing NPS data, customer records, and follow-up workflows, Google Workspace provides the shared infrastructure (Sheets, Docs, Gmail) that makes this manageable at no significant cost.
By the Numbers
- Companies with best-in-class NPS scores grow revenue 2.5x faster than industry averages, per Bain and Company research spanning 11 industries.
- Chewy’s NPS is estimated at 75+. Amazon’s in the same product category is approximately 55. Chewy’s service differentiation is the gap.
- Apple’s retail NPS consistently exceeds 70. The industry average for consumer electronics retail is approximately 45.
- Referred customers have a 16% higher lifetime value than non-referred customers, per research from the Journal of Marketing.
- A 12-point increase in NPS correlates with a doubling of word-of-mouth referral rates, per Reichheld’s original research.
The HL Loyalty Loop
This framework, developed at Hustler’s Library, outlines a systematic process for converting Detractors into Passives, Passives into Promoters, and Promoters into active referral engines.
Step 1: Survey and Segment
Run your NPS survey. Segment respondents into the three groups. Do not just note the score; read every open-text response from Detractors. These are your highest-value inputs. They are telling you exactly what to fix.
Step 2: Close the Loop with Detractors Within 48 Hours
Reach out personally to every Detractor within 48 hours of their response. Not with a scripted apology; with a genuine effort to understand what went wrong and fix it. Companies that close the loop with Detractors recover approximately 30% of them to neutral or positive status. The ones you do not contact often leave and write the reviews that damage your brand for years.
Step 3: Identify What Drives Promoters
Look at your Promoters’ open-text responses. What experiences, products, or moments drove their enthusiasm? These are your brand’s genuine strengths. Invest in making these experiences more consistent and more common.
Step 4: Activate Promoters
Most Promoters are willing to refer but need a trigger. Give them one: a referral program, a shareable moment, a community to join. American Express built their entire premium positioning around activating high-value customers as social proof: How American Express Made Customers Pay to Feel Elite.
Step 5: Convert Passives
Passives are the untapped middle. Identify what is preventing them from becoming Promoters: usually it is a specific friction point or unmet expectation. A targeted outreach campaign offering an upgrade, a discount, or a genuine check-in call can shift a meaningful percentage of Passives into Promoters with modest investment.
Step 6: Track Trends, Not Just Scores
A one-time NPS of 45 means nothing without context. A NPS that has gone from 30 to 45 over two years means you are doing something right. A NPS that dropped from 60 to 45 in one quarter means something broke and you need to find it now.
Key Takeaways
- NPS is the percentage of Promoters minus the percentage of Detractors. It is a leading indicator of growth, not a lagging report card.
- Word-of-mouth is the highest-converting, lowest-CAC acquisition channel. NPS measures whether your business is generating or destroying it.
- Chewy, Apple, and Costco obsess over customer experience because they understand that NPS compounds: every Promoter generates new customers at near-zero cost.
- You can measure NPS cheaply with free tools and a spreadsheet. What matters is tracking trends over time, not perfecting the survey instrument.
- The HL Loyalty Loop gives you a systematic way to convert Detractors and activate Promoters: close the loop fast, identify what drives enthusiasm, and give Promoters a reason to refer.
- Benchmark against your industry. A score of 40 is excellent in some sectors and average in others.
Sources & Further Reading
- Reichheld, F.F. (2003). The One Number You Need to Grow. Harvard Business Review.
- Reichheld, F.F. & Markey, R. (2011). The Ultimate Question 2.0. Harvard Business Review Press.
- Bain & Company. (2017). Measuring Your Net Promoter Score. bain.com
- Schmitt, P., Skiera, B., & Van den Bulte, C. (2011). Referral Programs and Customer Value. Journal of Marketing.
- CustomerGauge. (2022). NPS Benchmarks by Industry. customergauge.com
Want more breakdowns like this? Join Hustler’s Library free and get access to our full case study vault.
Ready to Know Where You Stand?
The Business Journey dashboard maps your exact position across all 13 stages. Track your progress, unlock resources for each step, and build with a framework used by thousands of founders at Hustler's Library.
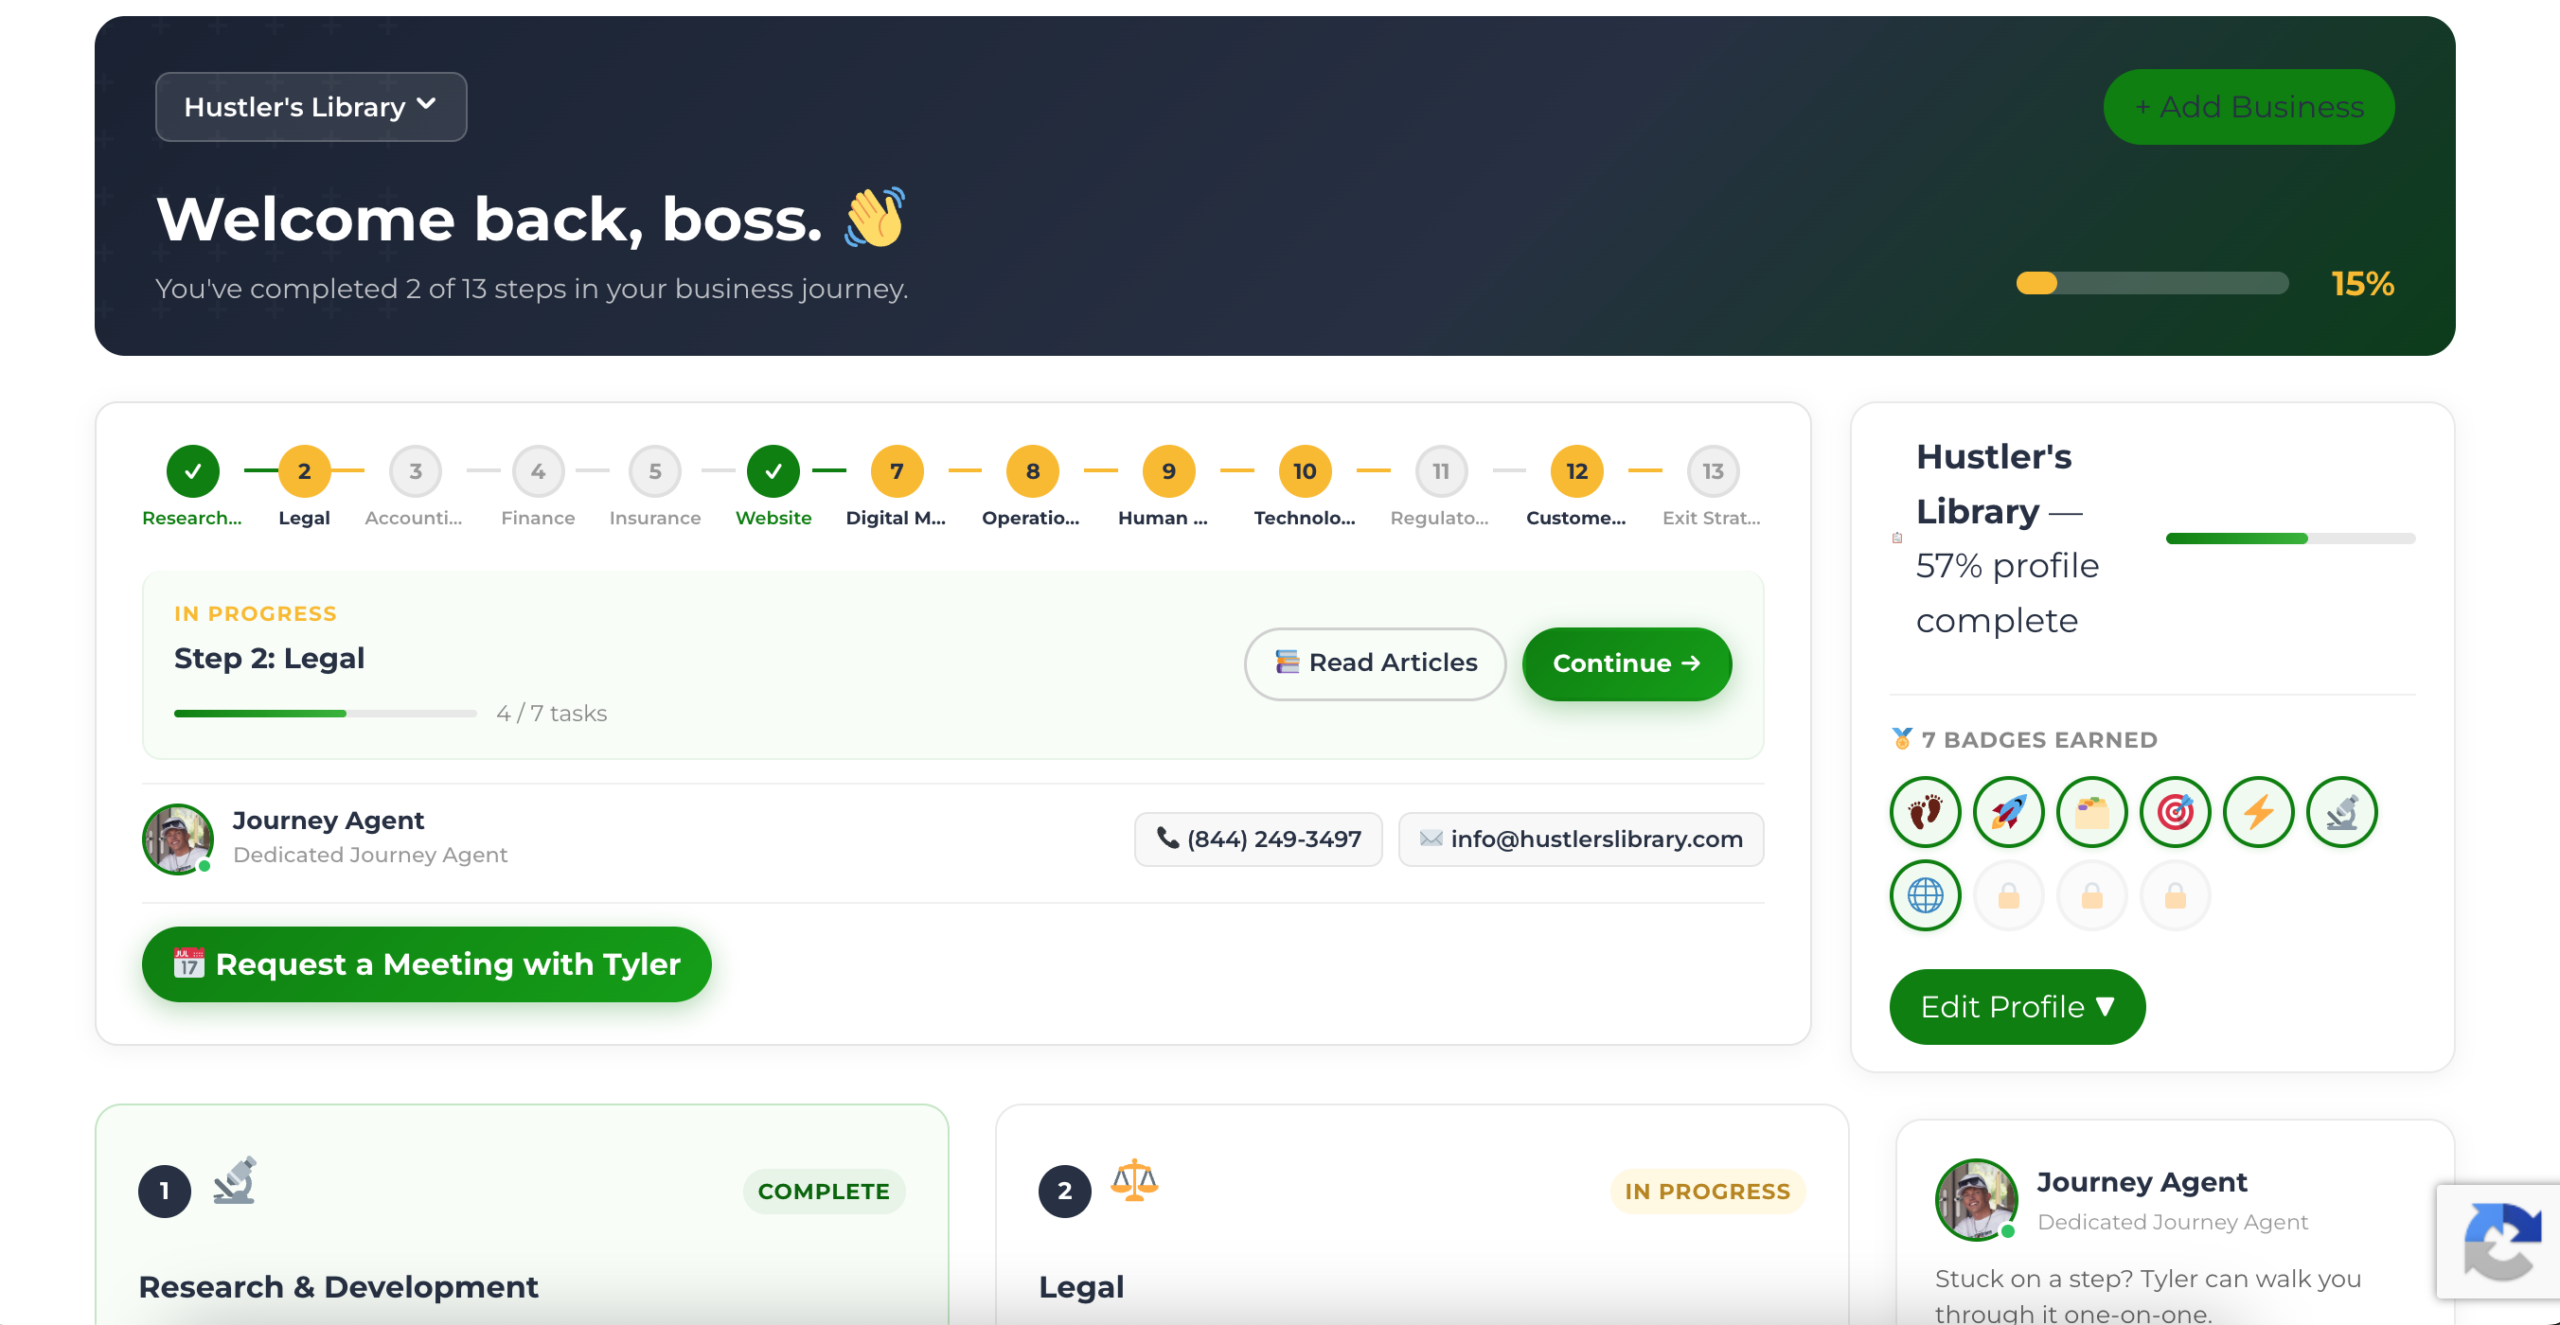
No credit card required · Takes 3 minutes · Personalized to your stage