

You sent the email. You hit publish. Now you’re staring at a dashboard full of percentages wondering what any of it actually means for your business.
Email marketing metrics aren’t complicated once you know what you’re looking for. But most small business owners either obsess over the wrong numbers or ignore their analytics entirely. This guide breaks down the metrics that actually matter, what good looks like, and how to move the needle on each one.
The Metrics That Actually Matter
Your email platform will show you a dozen different statistics after every send. Most of them are noise. These five are the ones worth watching closely.
Open Rate
Your open rate is the percentage of delivered emails that were opened. If you sent 1,000 emails, 900 were delivered, and 270 people opened them, your open rate is 30%.
Here’s what good looks like in 2026, according to Mailchimp’s industry benchmarks:
- All industries average: 21-23%
- E-commerce: 18-21%
- Professional services: 25-30%
- Nonprofits: 27-32%
- Restaurants and food: 24-28%
One important caveat: Apple’s Mail Privacy Protection (MPP), rolled out in 2021, inflates open rates for Apple Mail users by pre-loading tracking pixels. If your list skews toward iPhone and Mac users, your reported open rates may look 5-15% higher than they actually are. Use open rates as a directional signal, not gospel.
The biggest driver of open rate is your subject line. A compelling subject line on a cold list will outperform a weak one on a warm list almost every time. We’ve covered this in depth in our guide to subject line formulas that consistently get emails opened.
Click-Through Rate (CTR)
CTR measures the percentage of delivered emails that generated at least one click. This is often more useful than open rate because it measures actual engagement and intent.
Industry averages sit between 2-4% for most niches. If you’re above 3%, your content is resonating. Below 1% is a warning sign that your email content and your audience’s interests aren’t aligned, or your calls to action are buried and weak.
Some platforms also show Click-to-Open Rate (CTOR), which is clicks divided by opens rather than total delivered. This tells you how compelling your email body is for people who already decided to open. A healthy CTOR is 10-20%.
Bounce Rate
Bounces happen when an email can’t be delivered. There are two types and they are not equal.
Soft bounces are temporary failures: the recipient’s inbox is full, or their server was temporarily unavailable. Most platforms will retry these automatically.
Hard bounces are permanent failures: the email address doesn’t exist, or the domain is invalid. These are the ones you need to act on. A hard bounce rate above 2% will damage your sender reputation and hurt deliverability across your entire list.
Best practice: remove hard bounces from your list immediately and automatically. Any reputable ESP (email service provider) like Mailchimp, Klaviyo, or ActiveCampaign does this for you. Don’t override it.
Unsubscribe Rate
Most marketers panic when they see unsubscribes. Don’t. A small, consistent unsubscribe rate is healthy list hygiene. People change jobs, change interests, and move on. That’s fine.
What you’re watching for is spikes. If you send a campaign and your unsubscribe rate jumps from 0.2% to 1.5%, that’s signal. Either the content missed the mark, the frequency was too high, or you sent to a segment that wasn’t ready for that message.
Healthy unsubscribe rates sit below 0.5% per send. Below 0.2% is excellent.
Spam Complaint Rate
This is the metric most small business owners don’t watch closely enough, and it’s arguably the most dangerous one on this list.
Your spam complaint rate is the percentage of recipients who marked your email as spam. Gmail and Yahoo now have very strict thresholds: keep your complaint rate below 0.1%, and absolutely never exceed 0.3%. Once you breach 0.3%, major inbox providers will start routing your emails to spam by default, not just for the people who complained but for everyone you send to.
For a full breakdown of what actually triggers spam filters and how to protect your sender reputation, read our guide on why your emails are landing in spam and how to fix it.
Understanding Deliverability
Deliverability is the one metric that underlies all the others. If your emails aren’t making it to the inbox, open rates, CTR, and everything else is irrelevant.
Deliverability isn’t a single number you can pull from a dashboard. It’s a combination of your sender reputation, your domain authentication setup, your list quality, and your engagement history. Here’s what affects it most.
Domain Authentication (SPF, DKIM, DMARC)
If you’re sending email from a custom domain and haven’t set up SPF, DKIM, and DMARC records, you’re flying without a parachute. These DNS records tell receiving mail servers that your emails are legitimate and that you’re authorized to send on behalf of your domain.
- SPF (Sender Policy Framework): Specifies which mail servers are allowed to send email from your domain
- DKIM (DomainKeys Identified Mail): Adds a cryptographic signature to verify your emails haven’t been tampered with
- DMARC: Tells receiving servers what to do when SPF or DKIM checks fail
Since February 2024, Google and Yahoo have required bulk senders (more than 5,000 emails per day to Gmail) to have all three set up. Even if you’re below that threshold, setting up authentication is non-negotiable for serious senders.
Your ESP will walk you through this during onboarding. Do it before you send a single broadcast.
Sender Reputation and IP Warming
Every domain and IP address that sends email has a reputation score, maintained by major inbox providers. This score is built over time based on your engagement metrics, complaint rates, bounce rates, and the age of your sending domain.
If you’re new to email marketing or switching to a new sending domain, you need to warm up your IP gradually. Start by sending to your most engaged subscribers. Send small batches. Increase volume slowly over 4-6 weeks. Jumping straight to 10,000 emails on day one with a fresh domain will trigger spam filters regardless of your content quality.
List Hygiene and Engagement
Inbox providers watch how your list responds to your emails. If a large percentage of your subscribers never open anything, that’s a negative signal. It tells algorithms your emails aren’t valuable, which hurts your deliverability for everyone on your list, including your most engaged subscribers.
The solution is regular list cleaning. Suppress or remove subscribers who haven’t opened or clicked in 90-180 days. Before you remove them, run a re-engagement campaign with a blunt subject line like “Should we keep sending you emails?” You’ll win back a few. The rest can go without guilt.
This is covered in more detail in our breakdown of how to re-engage cold subscribers before removing them for good.
How to Read Your Analytics After Every Send
Here’s a simple post-send review routine to run within 48 hours of every email campaign:
- Check open rate vs. your list average. Is this above, below, or on par with your baseline? If it’s significantly lower, the subject line or send time may be the issue.
- Check CTR. Did people who opened actually click? If open rate is good but CTR is low, your email body or CTA isn’t landing.
- Check unsubscribes and complaints. Any spikes? If so, figure out why before your next send.
- Check bounces. Any hard bounces? Confirm your ESP suppressed them.
- Note what worked. Keep a simple log of subject lines and their open rates. Over 20-30 sends, patterns will emerge.
Metrics vs. Vanity Metrics
Open rate and subscriber count are the metrics most people brag about. Neither one pays bills.
The metrics that actually connect to revenue are conversion rate (how many email recipients took a desired action), revenue per email, and list growth rate relative to churn. If your welcome sequence is converting 8% of new subscribers to buyers within 30 days, that matters more than whether your open rate is 28% or 32%.
Track engagement metrics as diagnostics. Track revenue metrics as outcomes. Don’t confuse the two.
Tools That Help You Track and Improve
Most ESPs include built-in analytics that cover everything in this guide. Klaviyo and ActiveCampaign both have particularly strong reporting dashboards. If you’re on Mailchimp’s free tier, the analytics are functional but limited. Upgrade to at least the Essentials plan if you’re serious about tracking performance over time.
If you’re sending cold outreach alongside your email marketing and want unified tracking, a dedicated tool like Instantly or Lemlist can help. For deliverability monitoring specifically, tools like GlockApps or Mail-Tester let you run inbox placement tests before major sends.
Need help setting up a full email system from scratch or auditing what you have? A freelance email strategist on Fiverr can audit your deliverability, clean your list, and set up your automation stack in a matter of days without the cost of a full agency.
The External Resource Worth Bookmarking
Litmus publishes an annual email marketing benchmark report that breaks down open rates, CTR, and deliverability trends by industry. It’s one of the most reliable data sources in the email world. You can find the latest version here.
Start Here
If you want to improve your email metrics, start with the fundamentals: clean authentication, a healthy list, and a consistent sending schedule. Most deliverability and engagement problems aren’t strategy problems. They’re infrastructure problems that compound over time because nobody was watching the right numbers.
Pick one metric to focus on this month. Run experiments. Keep notes. Email is one of the highest-ROI marketing channels available to small business owners, but only if you treat it like a system, not a one-off blast.
Ready to build a real email strategy from scratch? Join Hustler’s Library free and get access to the full email marketing playbook.
Ready to Know Where You Stand?
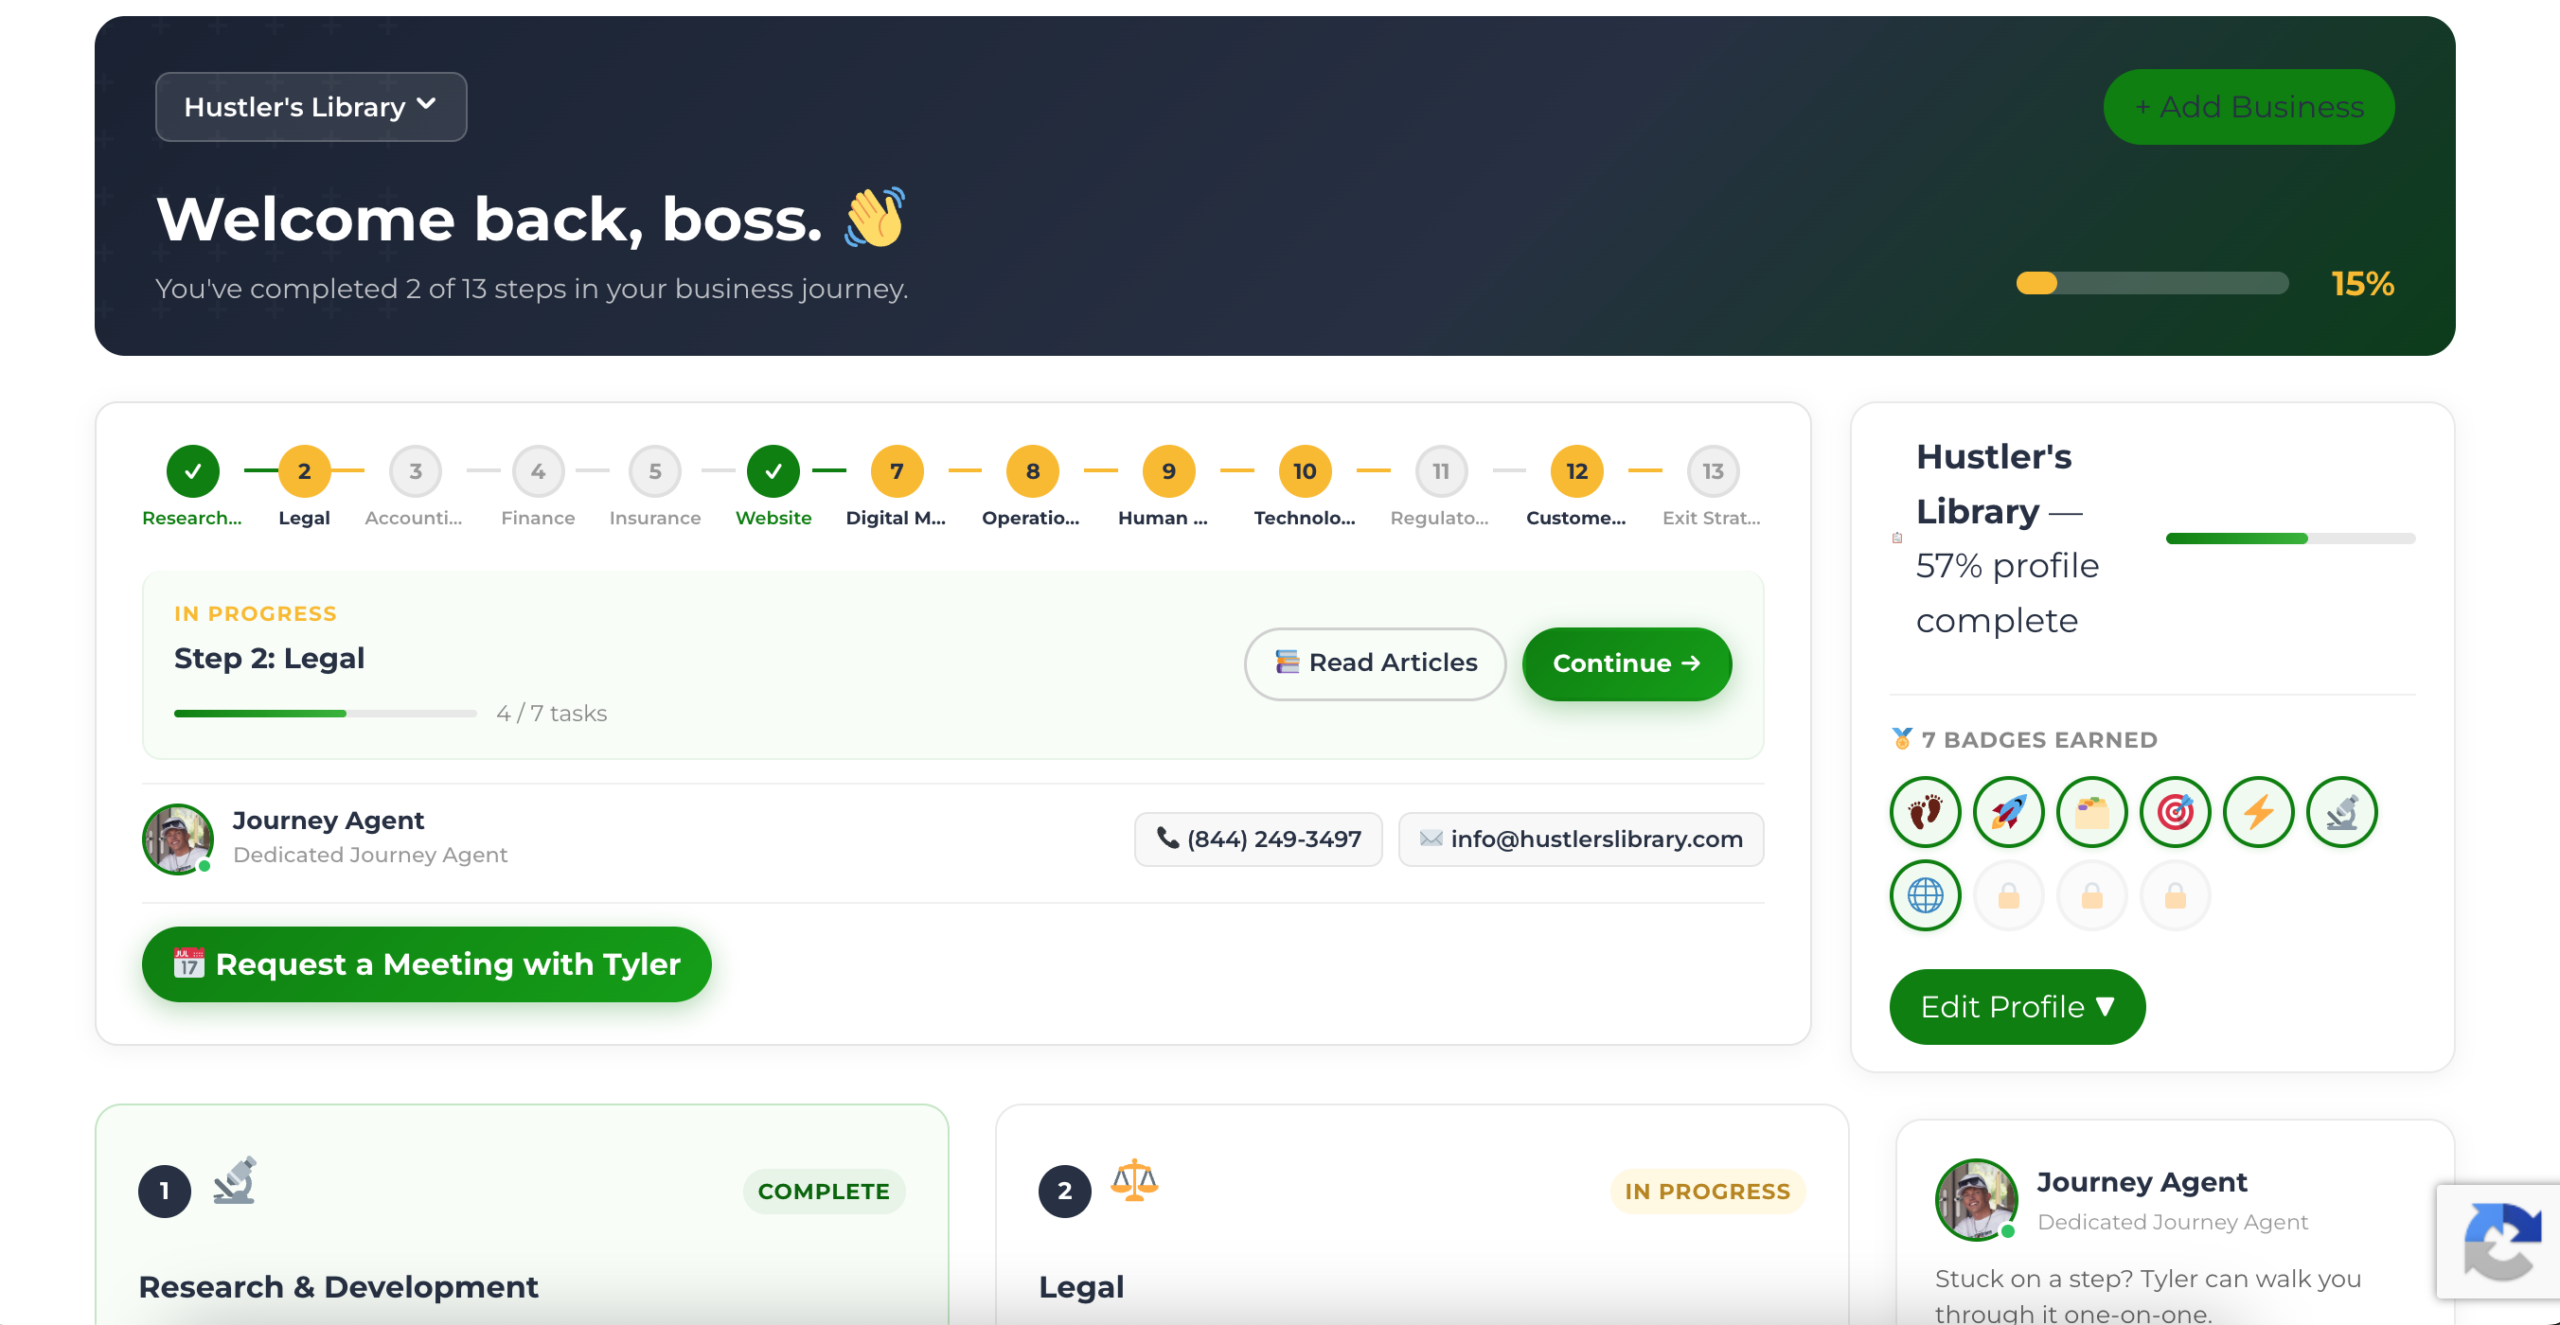
The Business Journey dashboard maps your exact position across all 13 stages. Track your progress, unlock resources for each step, and build with a framework used by thousands of founders at Hustler's Library.
No credit card required · Takes 3 minutes · Personalized to your stage