

If you run a small sales operation, you have probably looked at a dashboard full of numbers and felt confident, only to check your bank account and feel confused. Activity metrics can look great while your revenue quietly stalls. Knowing which numbers actually predict growth, and which ones just make you feel busy, is one of the most underrated skills in sales.
This post breaks down the metrics worth tracking, explains what they actually tell you, and shows you how to build a reporting habit that drives decisions instead of just documenting them.
Why Most Sales Dashboards Lie to You
Vanity metrics are numbers that look impressive but do not correlate with revenue. The classic example is call volume. A rep who makes 80 calls a day sounds productive. But if those calls are to the wrong prospects with the wrong pitch, they produce nothing except fatigue and a misleading activity report.
Vanity metrics tend to reward effort over outcomes. They are easy to measure and easy to inflate, which makes them popular with sales managers who want to look busy and reps who want to look productive. The problem is that none of it translates to closed deals.
The metrics that actually matter are the ones that predict future revenue or diagnose problems in your pipeline right now. They are harder to track cleanly, but they are worth every ounce of effort.
The 6 Sales Metrics You Should Actually Track
1. Conversion Rate at Each Stage
Your funnel has multiple stages: lead to prospect, prospect to opportunity, opportunity to proposal, proposal to close. Most businesses only track the final conversion rate (how many deals closed divided by total leads), which tells you almost nothing about where deals are dying.
Stage-by-stage conversion rates show you exactly where your funnel leaks. If you are converting 60% of prospects to opportunities but only 15% of opportunities to proposals, you have a discovery or qualification problem. If proposals convert at 20% when they should be at 40%, your proposals need work, or you are presenting to unqualified buyers.
Calculate each stage conversion weekly. If a number drops two weeks in a row, investigate immediately before it becomes a pipeline crisis.
2. Average Deal Size
This number tells you the average revenue value of a closed deal. Tracking it over time reveals whether your sales motion is moving upmarket or down, and whether discounting is eroding your revenue per sale.
If your average deal size is shrinking but deal count is growing, you might be winning the wrong customers. If average deal size is growing, your team is probably selling to better-fit buyers and doing a better job of presenting value.
Segment this by rep, by lead source, and by customer type. A rep with lower average deal sizes may be cherry-picking easy closes. A lead source with lower average deal sizes may be bringing in price-sensitive buyers who churn faster.
3. Sales Cycle Length
How long does it take, on average, from first contact to closed deal? Sales cycle length affects your cash flow planning, your forecasting accuracy, and your ability to hire. A business with a 7-day sales cycle needs to operate very differently than one with a 90-day cycle.
Track this by product tier, deal size, and lead source. You will often find that referrals close in half the time of cold outbound leads, which tells you something important about where to focus your prospecting energy. Understanding your sales cycle also helps you spot deals that are stalling. If your average cycle is 21 days and a deal is on day 45 with no movement, it is not a deal. It is a distraction.
4. Win Rate
Win rate is the percentage of opportunities your team closes. An opportunity is a qualified prospect you have actively pitched. If you are winning 30% of opportunities, you are losing 70%. The question is why.
Track win rate by rep and by competitor. If one rep wins 45% and another wins 18%, the gap is not luck. There is a skill difference, a territory difference, or a targeting difference worth understanding. If you are losing consistently to one specific competitor, that is a positioning and messaging problem you can fix.
HubSpot‘s research on win rates consistently shows that the top sales teams do not just close more, they qualify better, which means their win rate is higher because they are not wasting time on deals they were never going to win. Read more on HubSpot’s sales metrics guide for benchmarks by industry.
5. Revenue Per Rep (or Per Hour)
This is the most honest performance metric you have. It does not care how many calls were made or how many emails were sent. It just asks: how much revenue did this person generate?
For a solo business owner, this becomes revenue per hour spent on sales activity, which helps you decide whether to hire, delegate, or change your approach. If you are generating $200 per hour on outbound calls but $600 per hour on referral follow-up, the math on where to spend your time is obvious.
6. Pipeline Coverage Ratio
Your pipeline coverage ratio is the total value of your active pipeline divided by your revenue target for the period. A common benchmark is 3x coverage: if you want to close $50,000 this month, you should have at least $150,000 in active pipeline.
This ratio accounts for the fact that not every deal closes. If your win rate is 33%, you need 3x pipeline to hit your number. If your win rate is 25%, you need 4x coverage. Tracking this weekly tells you whether your pipeline is healthy before the end of the month arrives and the shortfall becomes obvious.
The Metrics You Can Stop Obsessing Over
These are not worthless, but they are commonly overweighted:
Total calls made. Call volume without connection rate and conversion rate is noise. A rep making 60 calls with a 40% connection rate and 20% conversion rate is outperforming one making 100 calls with a 15% connection rate and 5% conversion rate.
Emails sent. Open rates and reply rates matter. Volume alone does not.
Number of leads generated. Leads without qualification context inflate your pipeline and distort your forecasting. A hundred unqualified leads are worse than 10 qualified ones because they consume your team’s time and make your numbers look better than they are.
Social media followers and website traffic. Unless you can draw a direct line from these to pipeline opportunities, they belong in the marketing report, not the sales report.
How to Build a Weekly Sales Review That Actually Works
Most sales reviews are historical. They look at what happened last week and describe it. Useful sales reviews are diagnostic. They look at what is happening right now and ask why.
Here is a simple weekly cadence that works for small sales teams:
Monday (15 minutes): Review pipeline by stage. Flag any deals that have been in the same stage for more than two sales cycle lengths. Assign action items to move or close them out.
Wednesday (30 minutes): Review conversion rates from the prior week. Did any stage conversion drop? Are win rates tracking? Is average deal size stable?
Friday (10 minutes): Log the week’s revenue and update pipeline coverage ratio for the month. Are you on track? If not, what needs to change next week?
This takes about an hour per week and gives you more clarity than most companies get from hour-long meetings every day. Pair this with a simple CRM setup, and your numbers will start telling you stories instead of just recording history. If you have not set up a pipeline yet, our guide on how to set up a sales pipeline in HubSpot walks through the whole process.
A Quick-Reference Metrics Template
Copy this into your CRM or a spreadsheet and update it weekly:
- Pipeline value (total active): $_____
- Pipeline coverage ratio: ___x
- Stage conversion rates: Lead to prospect: ___% | Prospect to opp: ___% | Opp to proposal: ___% | Proposal to close: ___%
- Win rate (this month): ___%
- Average deal size (this month): $_____
- Average sales cycle (days): _____
- Revenue closed (this month): $_____
- Revenue target (this month): $_____
- On track? Yes / No / Behind
You do not need a complex system. You need a consistent one. If you check these numbers every week, you will catch problems two to three weeks before they show up in your bank account. That lead time is the difference between a course correction and a crisis.
For more on building the systems underneath your sales operation, see our post on the best CRM for small business, which covers how to choose the right tool to track all of this automatically.
Want to go deeper on sales leadership? Harvard Business Review’s piece on sales management is worth 10 minutes of your time.
Running a tight, metrics-driven sales operation is not about being a numbers person. It is about replacing guesswork with information. Once you know where deals die, you can fix it. Once you know which activities actually move revenue, you can double down on them and stop wasting time on everything else.
Ready to build a smarter business? Join Hustler’s Library for free and get access to guides, templates, and tools for every stage of growth.
Ready to Know Where You Stand?
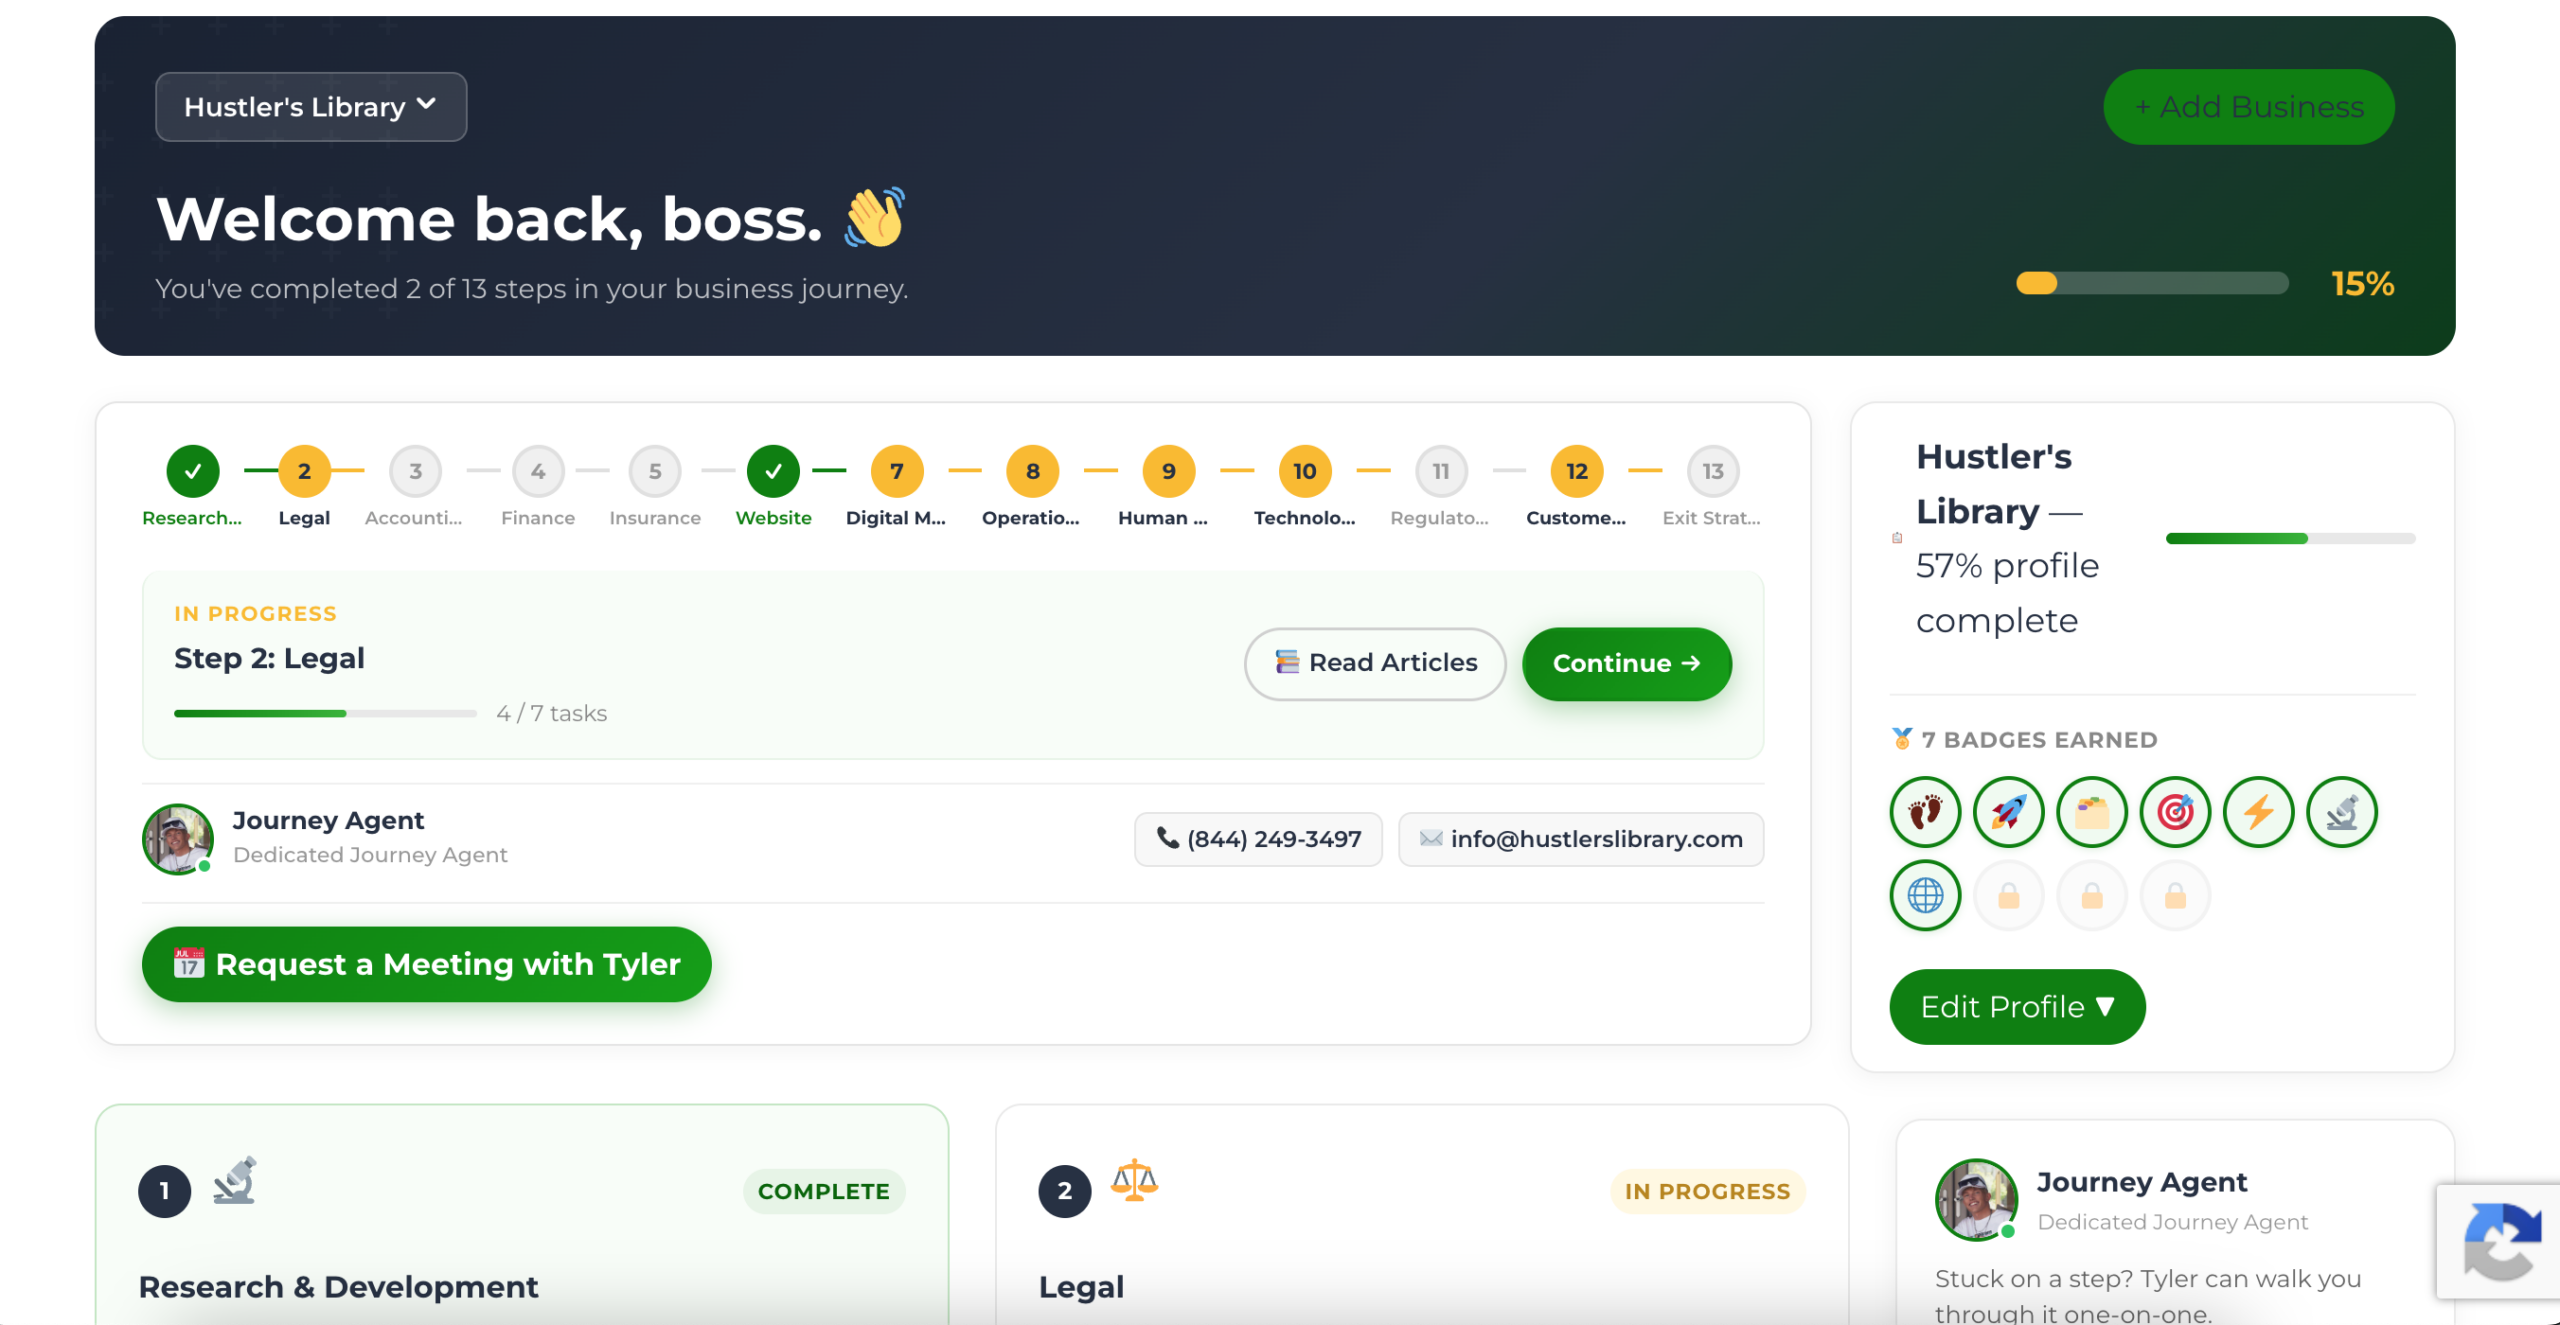
The Business Journey dashboard maps your exact position across all 13 stages. Track your progress, unlock resources for each step, and build with a framework used by thousands of founders at Hustler's Library.
No credit card required · Takes 3 minutes · Personalized to your stage