

If you own a small business that employs even one or two people, labor is almost certainly your biggest expense. Wages, benefits, payroll taxes, overtime, bonuses, and the hidden costs of turnover can quietly devour your margins before you ever notice. Yet most small business owners track labor spending only in the most basic way: they look at the payroll number at the end of the month and shrug.
Labor cost analysis is the practice of digging beneath that number to understand what you are actually getting for every dollar you spend on people. Done right, it shows you where you are overstaffed, where you are leaving money on the table, and where a small adjustment can have a meaningful impact on profitability. It does not require a finance degree or expensive software. You just need the right framework and a willingness to look at the numbers honestly.
Why Labor Cost Analysis Matters
For service businesses, labor often accounts for 50 to 70 percent of total revenue. For retail and restaurant businesses, it typically runs between 25 and 35 percent. Even a one or two percent improvement in labor efficiency can translate directly into thousands of dollars in additional profit each year.
Beyond the raw numbers, analyzing labor costs helps you make better hiring decisions, schedule more intelligently, identify underperforming roles, and plan for growth. Instead of reacting to payroll problems after they happen, you get ahead of them.
Step 1: Calculate Your Total Labor Cost
Most business owners only count base wages when they think about labor costs. That is a mistake. Your true labor cost includes:
- Gross wages and salaries for all employees, including part-time and seasonal workers
- Employer payroll taxes, which typically add 7.65 percent on top of gross wages for Social Security and Medicare alone
- Health insurance contributions, retirement plan matching, and any other benefits you provide
- Workers’ compensation insurance premiums, which vary by industry and role
- Overtime and holiday pay, which can spike dramatically in certain seasons or during busy periods
- Bonuses and commissions paid throughout the year
When you add all of these together, the true cost of an employee is usually 25 to 40 percent higher than their base wage. A worker earning $20 per hour might actually cost you $26 to $28 per hour when everything is included. Building your analysis on fully loaded labor costs rather than just wages gives you a far more accurate picture.
Step 2: Calculate Your Labor Cost Percentage
The most useful starting benchmark is your labor cost percentage, which is simply your total labor cost divided by your total revenue, multiplied by 100. If you spent $40,000 on labor in a month and brought in $120,000 in revenue, your labor cost percentage is 33.3 percent.
Compare this number against industry averages for your sector. The U.S. Bureau of Labor Statistics and the Small Business Administration publish data that can help you benchmark your numbers against similar businesses. If you are running significantly higher than the industry average, you have an opportunity to improve. If you are below average, you may actually be under-investing in staffing in a way that limits your capacity to grow.
Step 3: Break It Down by Role and Department
An overall labor cost percentage is useful, but it hides important details. The next step is to break your labor spending down by role, team, or department so you can see where the money is actually going.
For each position or team, ask:
- What is this role actually producing in revenue, output, or value?
- Is this person or team fully utilized, or are there stretches of idle time built into the schedule?
- Could this work be done more efficiently with better tools, processes, or scheduling?
- Is this a revenue-generating role, a support role, or an overhead role?
This kind of role-by-role breakdown often surfaces surprising insights. You might find that a support role you assumed was necessary is actually generating little measurable value, or that a frontline position that generates revenue directly is being paid far below market rate in a way that threatens retention.
Step 4: Analyze Labor Productivity
Labor productivity measures how much revenue or output each employee generates per dollar of labor cost. The simplest version is revenue per employee: total revenue divided by the total number of full-time equivalent employees. If your business brings in $600,000 per year and you have 10 full-time employees, your revenue per employee is $60,000.
You can also calculate gross profit per labor dollar, which tells you how much gross profit you generate for every dollar you spend on labor. This is a more nuanced metric because it strips out the cost of goods sold and focuses purely on the margin your labor is producing. If this number is shrinking over time, it often means that wages are rising faster than productivity or revenue.
Tracking these numbers monthly or quarterly lets you spot trends before they become problems. A steady decline in labor productivity is a warning sign that is worth investigating before it shows up as a bad quarter.
Step 5: Identify Scheduling Inefficiencies
For businesses with hourly workers, scheduling is often where the biggest labor cost savings hide. Overstaffing during slow periods drives up costs without a corresponding increase in revenue. Understaffing during busy periods forces you into expensive overtime and can hurt the customer experience.
Pull your sales and revenue data by day of the week and time of day. Map your labor hours against those patterns. If you are consistently running more labor hours on slow afternoons than on busy Saturday mornings, you have a scheduling problem that is costing you money. Small adjustments, like shifting start times, staggering shifts, or building more flexibility into part-time schedules, can meaningfully reduce your labor cost percentage without reducing service quality.
This kind of data-driven scheduling is exactly the type of operational improvement that can separate a marginally profitable small business from a comfortably profitable one. For a deeper look at operational strategy, see our guide on how to improve operational efficiency in your small business.
Step 6: Factor in the Cost of Turnover
Turnover is one of the most expensive and least measured labor costs in small business. When an employee leaves, the true cost includes recruiting, screening, and interviewing replacement candidates, the time your team spends covering the gap, onboarding and training the new hire, and the productivity loss while that person gets up to speed.
Research from the Society for Human Resource Management estimates that replacing an employee typically costs between 50 and 200 percent of their annual salary depending on the role. For a small business, even one or two unexpected departures per year can add tens of thousands of dollars in hidden costs to your labor budget.
This is why investing in retention, whether through competitive pay, better management, flexible scheduling, or a stronger culture, often delivers a better return than focusing exclusively on keeping wages low. Your labor cost analysis should always include a realistic estimate of what turnover is actually costing you.
Step 7: Use the Data to Make Decisions
Labor cost analysis is only valuable if you act on what you find. Here are a few ways the data typically informs smarter decisions:
- Hiring decisions: If revenue per employee is healthy and labor cost percentage is below your target, you have room to hire. If both metrics are under pressure, adding headcount will make things worse before you address underlying inefficiencies.
- Pricing decisions: If your labor costs are rising and your margins are shrinking, that is often a signal that your prices need to increase. Many small business owners absorb rising labor costs rather than adjusting pricing, which slowly erodes profitability.
- Automation decisions: When you can see exactly how many hours are going to a specific task, it becomes much easier to evaluate whether automating that task would pay off. The math is straightforward: if a software tool costs $200 per month and eliminates five hours of labor per week, the ROI is often immediate.
- Growth planning: Understanding your labor cost structure helps you model what growth will actually cost. If adding 20 percent in revenue requires 30 percent more labor, your growth is not as profitable as it looks on paper.
For businesses planning ahead, pairing labor cost analysis with broader financial planning will strengthen your strategy. Our guide on how to use financial forecasting to plan for growth is a helpful complement to the work you do here.
Tools to Make This Easier
You do not need expensive software to run a solid labor cost analysis. A well-organized spreadsheet can handle most of what you need. Pull your payroll data from your payroll provider, your revenue data from your point-of-sale system or accounting software, and your scheduling data from wherever you currently track it. Build a simple monthly dashboard that shows labor cost percentage, revenue per employee, and gross profit per labor dollar. Update it every month and look at the trends over time.
If you use accounting software like QuickBooks or Xero, many of these metrics can be generated with built-in reports. Dedicated workforce management tools like Homebase, Deputy, or When I Work can also automate much of the scheduling analysis once you understand what you are looking for.
The Bottom Line
Labor cost analysis is not about squeezing your team or looking for reasons to cut pay. It is about understanding the full picture of what your workforce costs and what it produces, so you can make smarter decisions across hiring, scheduling, pricing, and growth planning. The business owners who do this well are rarely surprised by a bad payroll month. They see the patterns early and act before small problems become expensive ones.
Start simple. Calculate your labor cost percentage this month. Break it down by team or role. Compare it to last quarter and to your industry benchmark. The insights you find in those first numbers will show you exactly where to look next.
Want more tools and guides to help you run a smarter, more profitable business? Join Hustler’s Library for free and get access to our full resource library built for serious small business owners.
Ready to Know Where You Stand?
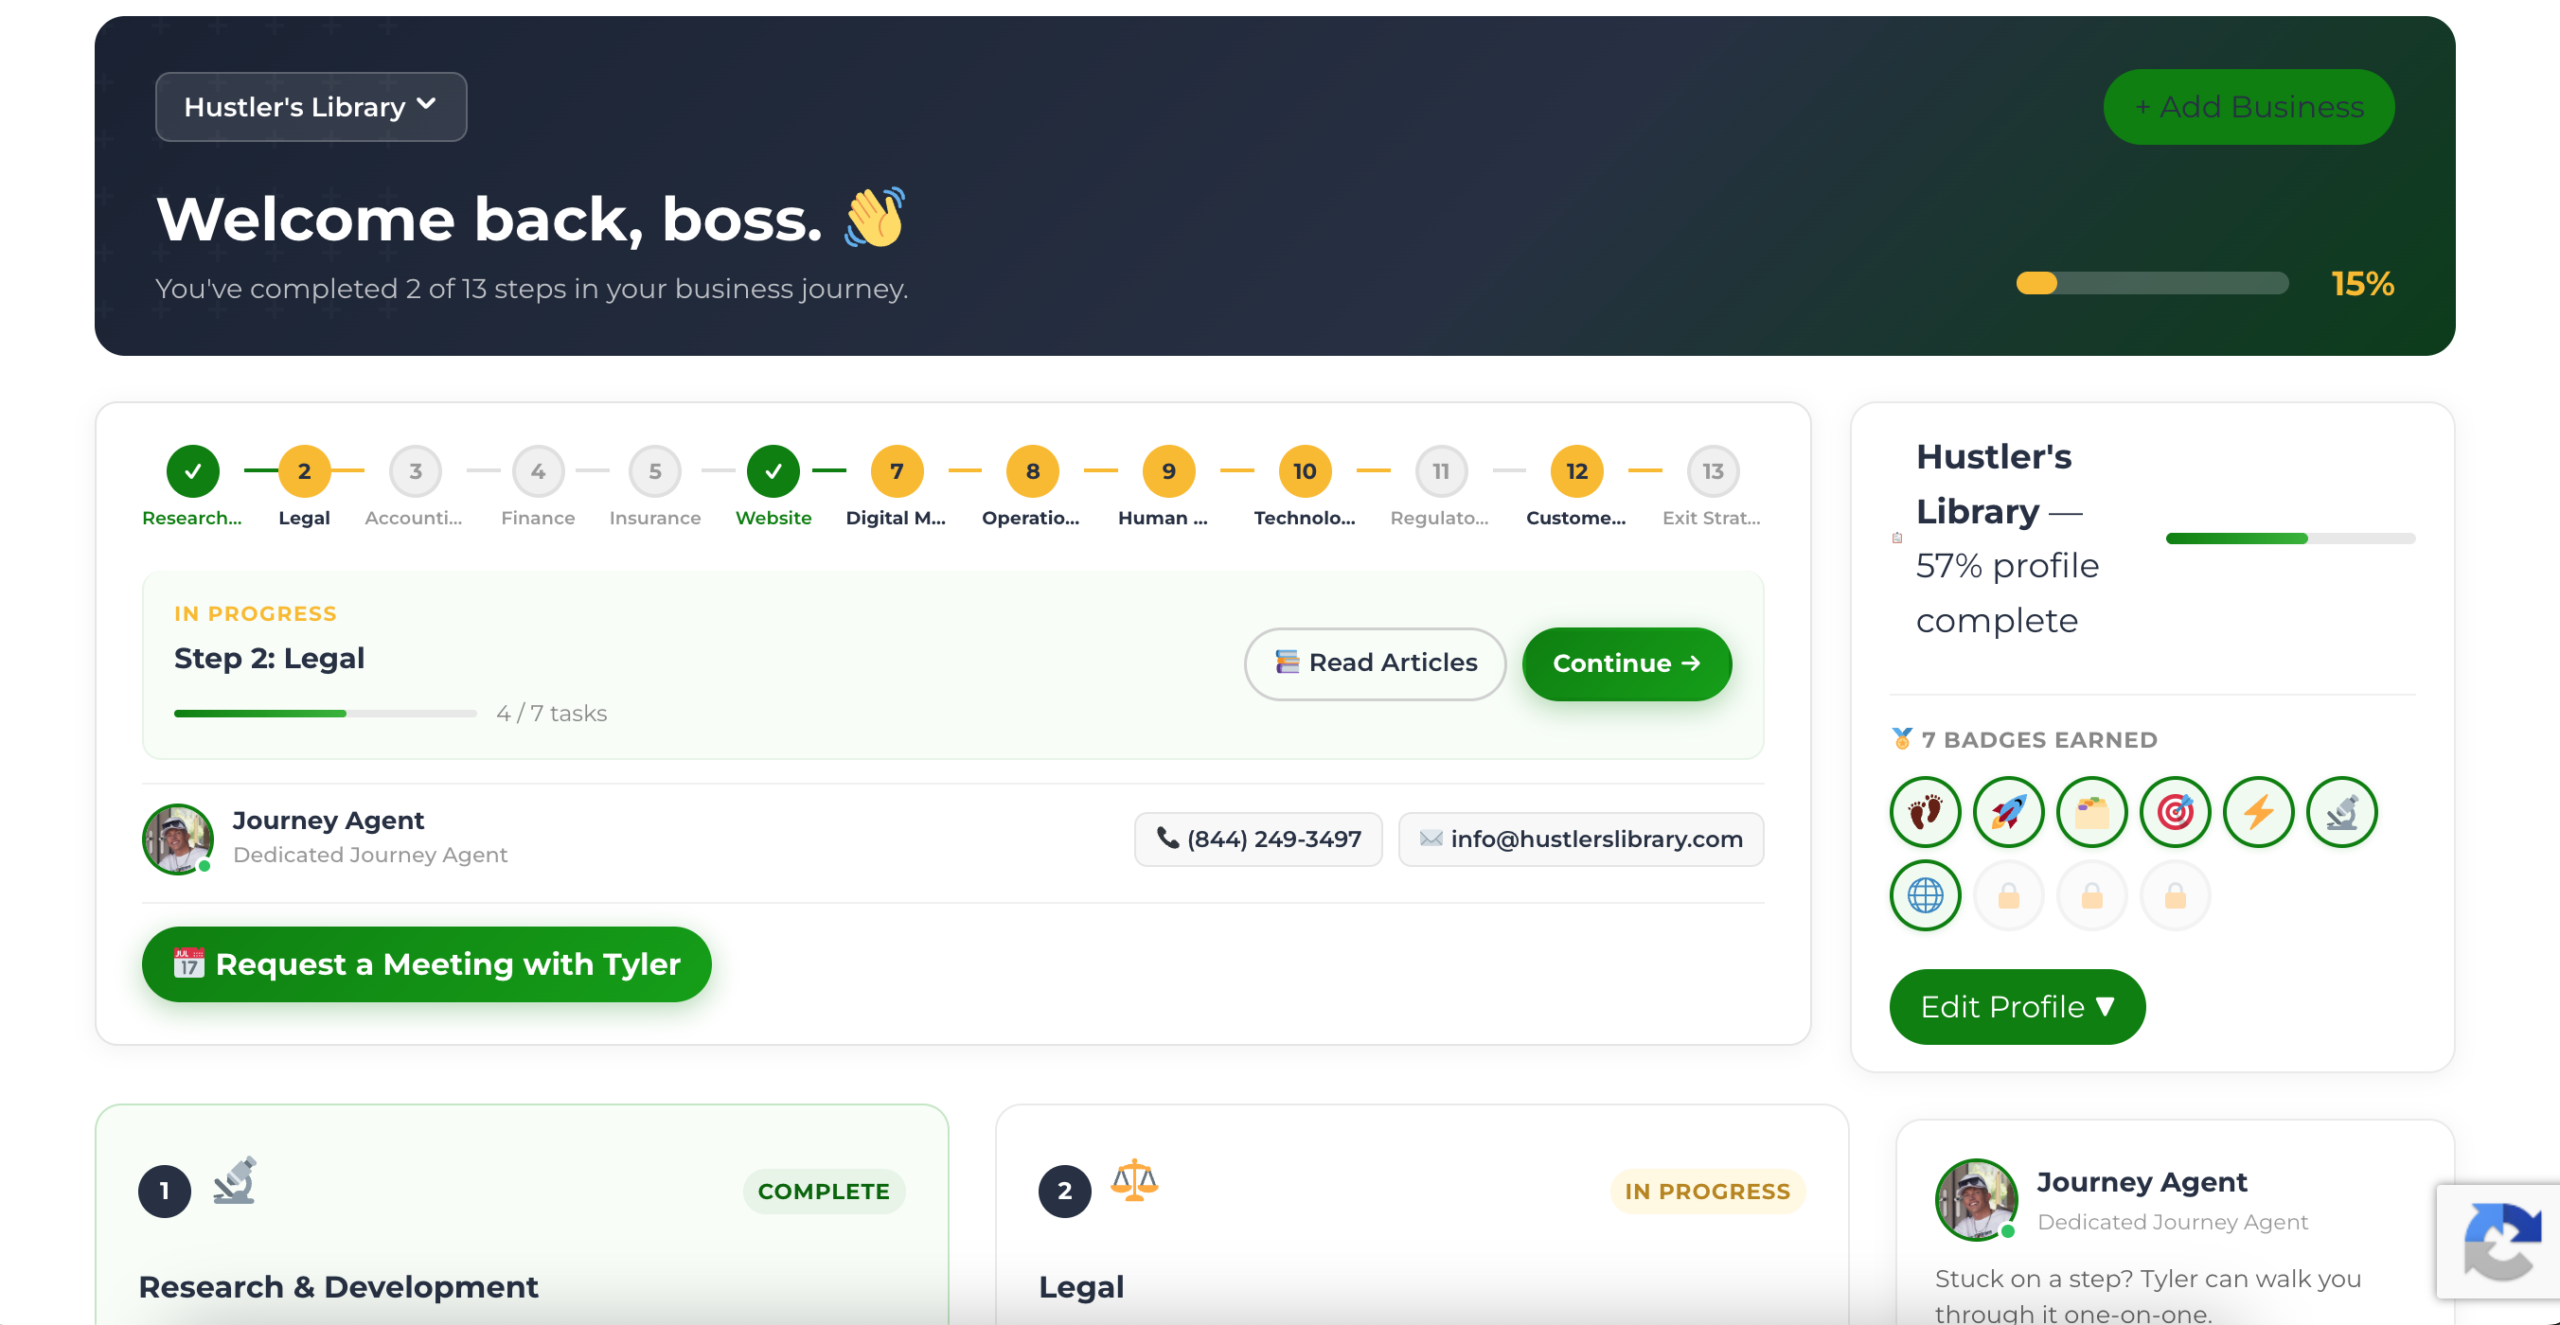
The Business Journey dashboard maps your exact position across all 13 stages. Track your progress, unlock resources for each step, and build with a framework used by thousands of founders at Hustler's Library.
No credit card required · Takes 3 minutes · Personalized to your stage