

Every small business owner tracks something. Revenue. Expenses. Whether there’s enough in the account to make payroll. These are the basics, and if you’re watching them, you’re ahead of the crowd.
But there’s a whole category of numbers that most owners never look at, numbers that often predict trouble weeks or months before it shows up on the income statement. By the time the obvious metrics flash red, the damage is already done.
These are the early warning signals. The leading indicators. The numbers that separate owners who catch problems early from those who get blindsided.
1. Revenue Per Employee (or Revenue Per Contractor)
Divide your total revenue by the number of people doing the work. That single number tells you more about your operational efficiency than almost anything else.
A service business generating $400,000 a year with four full-time employees is running at $100,000 per person. A competitor doing $600,000 with three people is running at $200,000. Same industry, very different trajectories.
If your revenue per person is declining, you’re either taking on less profitable work, adding people faster than you’re adding revenue, or both. Neither is sustainable. Track this number quarterly and watch the trend.
2. Lead-to-Close Time
How long does it take from first contact with a prospect to a signed deal? Most owners know their close rate (how many proposals they win), but almost none track how long the process takes.
When lead-to-close time starts stretching out, it’s a leading indicator that something is off. Prospects are stalling. Your market may be softening. Your offer might need work. Or you might be chasing the wrong leads.
A sales cycle that normally takes two weeks but is suddenly taking six tells you something important before your pipeline dries up. Catch it early and you have time to course-correct.
3. Repeat Purchase Rate
Of the customers who bought from you in the last 12 months, what percentage came back for a second purchase? For service businesses: what percentage of clients renewed, expanded, or referred someone?
This is a direct measure of whether your customers are satisfied enough to return. If it’s declining, you may have a delivery problem, a product problem, or a relationship problem. None of them show up immediately in revenue because you’re still closing new clients while existing ones quietly drift away.
The difference between a customer and a client often comes down to this metric. Customers transact. Clients return. Knowing your repeat rate tells you which one you’re actually building.
4. Days Sales Outstanding (DSO)
DSO is the average number of days it takes to collect payment after you’ve delivered your product or service. It’s calculated simply: divide your accounts receivable by your average daily revenue.
If your payment terms are net-30 and your DSO is 45, that gap is costing you money in the form of delayed cash flow. If DSO is creeping up over time, your clients are stretching their payments further and further, which can quietly choke a business that looks profitable on paper.
The SBA notes that cash flow problems are one of the leading causes of small business failure, and DSO creep is one of the quietest contributors. Managing your business finances starts with knowing how fast money is actually moving.
5. Cost of Customer Acquisition (CAC) vs. Lifetime Value (LTV)
How much does it cost you to win a new customer? And how much does that customer generate over their entire relationship with your business?
Most owners track marketing spend in general terms but never isolate the cost per new customer. And even fewer have estimated lifetime value beyond a single transaction.
When CAC is rising while LTV is flat, you’re working harder for less. When both are tracked, you can make smarter decisions about which marketing channels to invest in, which customer segments to prioritize, and when growth is actually profitable versus just expensive.
6. Gross Margin by Product or Service Line
Most owners know their overall gross margin. Fewer break it down by offering. This distinction is where a lot of hidden money gets left on the table.
You might be running a service business with three offerings. Service A has a 60% gross margin, Service B has 40%, and Service C has 20%. If you’re spending equal time and energy on all three, you’re essentially subsidizing the low-margin work with profits from the high-margin work. When you map this out, the right move often becomes obvious.
This connects directly to the principle behind margin over volume: doing fewer things at higher margin usually outperforms doing everything at average margin.
7. Employee Utilization Rate
For service businesses especially, this one is critical. Utilization rate is the percentage of your team’s working hours that are billable or directly productive (versus administrative, idle, or overhead time).
If you’re paying for 40 hours a week per person and only 25 of those hours are generating revenue, your true labor cost per billable hour is significantly higher than you think. A utilization rate below 60-65% in a service business usually signals a capacity and workflow problem that’s bleeding margin quietly every month.
Track this monthly. When it dips, investigate before it shows up on the income statement.
8. Net Promoter Score (Or a Simple Version of It)
You don’t need a formal survey tool. The core question is simple: on a scale of 1 to 10, how likely are you to recommend us to a friend or colleague?
Ask it after every completed project or transaction. Track the average score over time. If it’s declining, your reputation is declining with it, and that shows up in referrals, repeat business, and client retention before it shows up in revenue.
Most small business owners know intuitively that their customers are happy or unhappy. This metric forces you to quantify it, and quantifying it creates accountability.
How to Start Without Getting Overwhelmed
You don’t need to track all eight of these starting tomorrow. Pick two or three that are most relevant to where your business is right now, and build the habit of looking at them monthly.
A simple spreadsheet works. A notes app works. The tool doesn’t matter; the habit does. Once you see these numbers moving in real time, you’ll start connecting them to the decisions you’re making, and that’s when the insights get valuable.
The IRS and SBA both recommend that small business owners review key financial and operational metrics regularly, not just at tax time. Good recordkeeping is the foundation, but what you do with that data is where the competitive edge lives.
The Bottom Line
The business owners who catch problems early, and capitalize on opportunities faster, aren’t necessarily smarter or luckier. They’re looking at different numbers. Numbers that tell you what’s coming instead of what already happened.
Revenue and expenses tell you where you’ve been. Repeat rate, lead-to-close time, utilization, and DSO tell you where you’re headed. Both matter. But most owners only have one.
Add one leading indicator to your monthly review this month. Just one. Track it for 90 days. See what it shows you that your income statement never could.
Want more resources like this? Join thousands of small business owners getting actionable strategies every week. Join Hustler’s Library for free and start building a smarter business today.
Ready to Know Where You Stand?
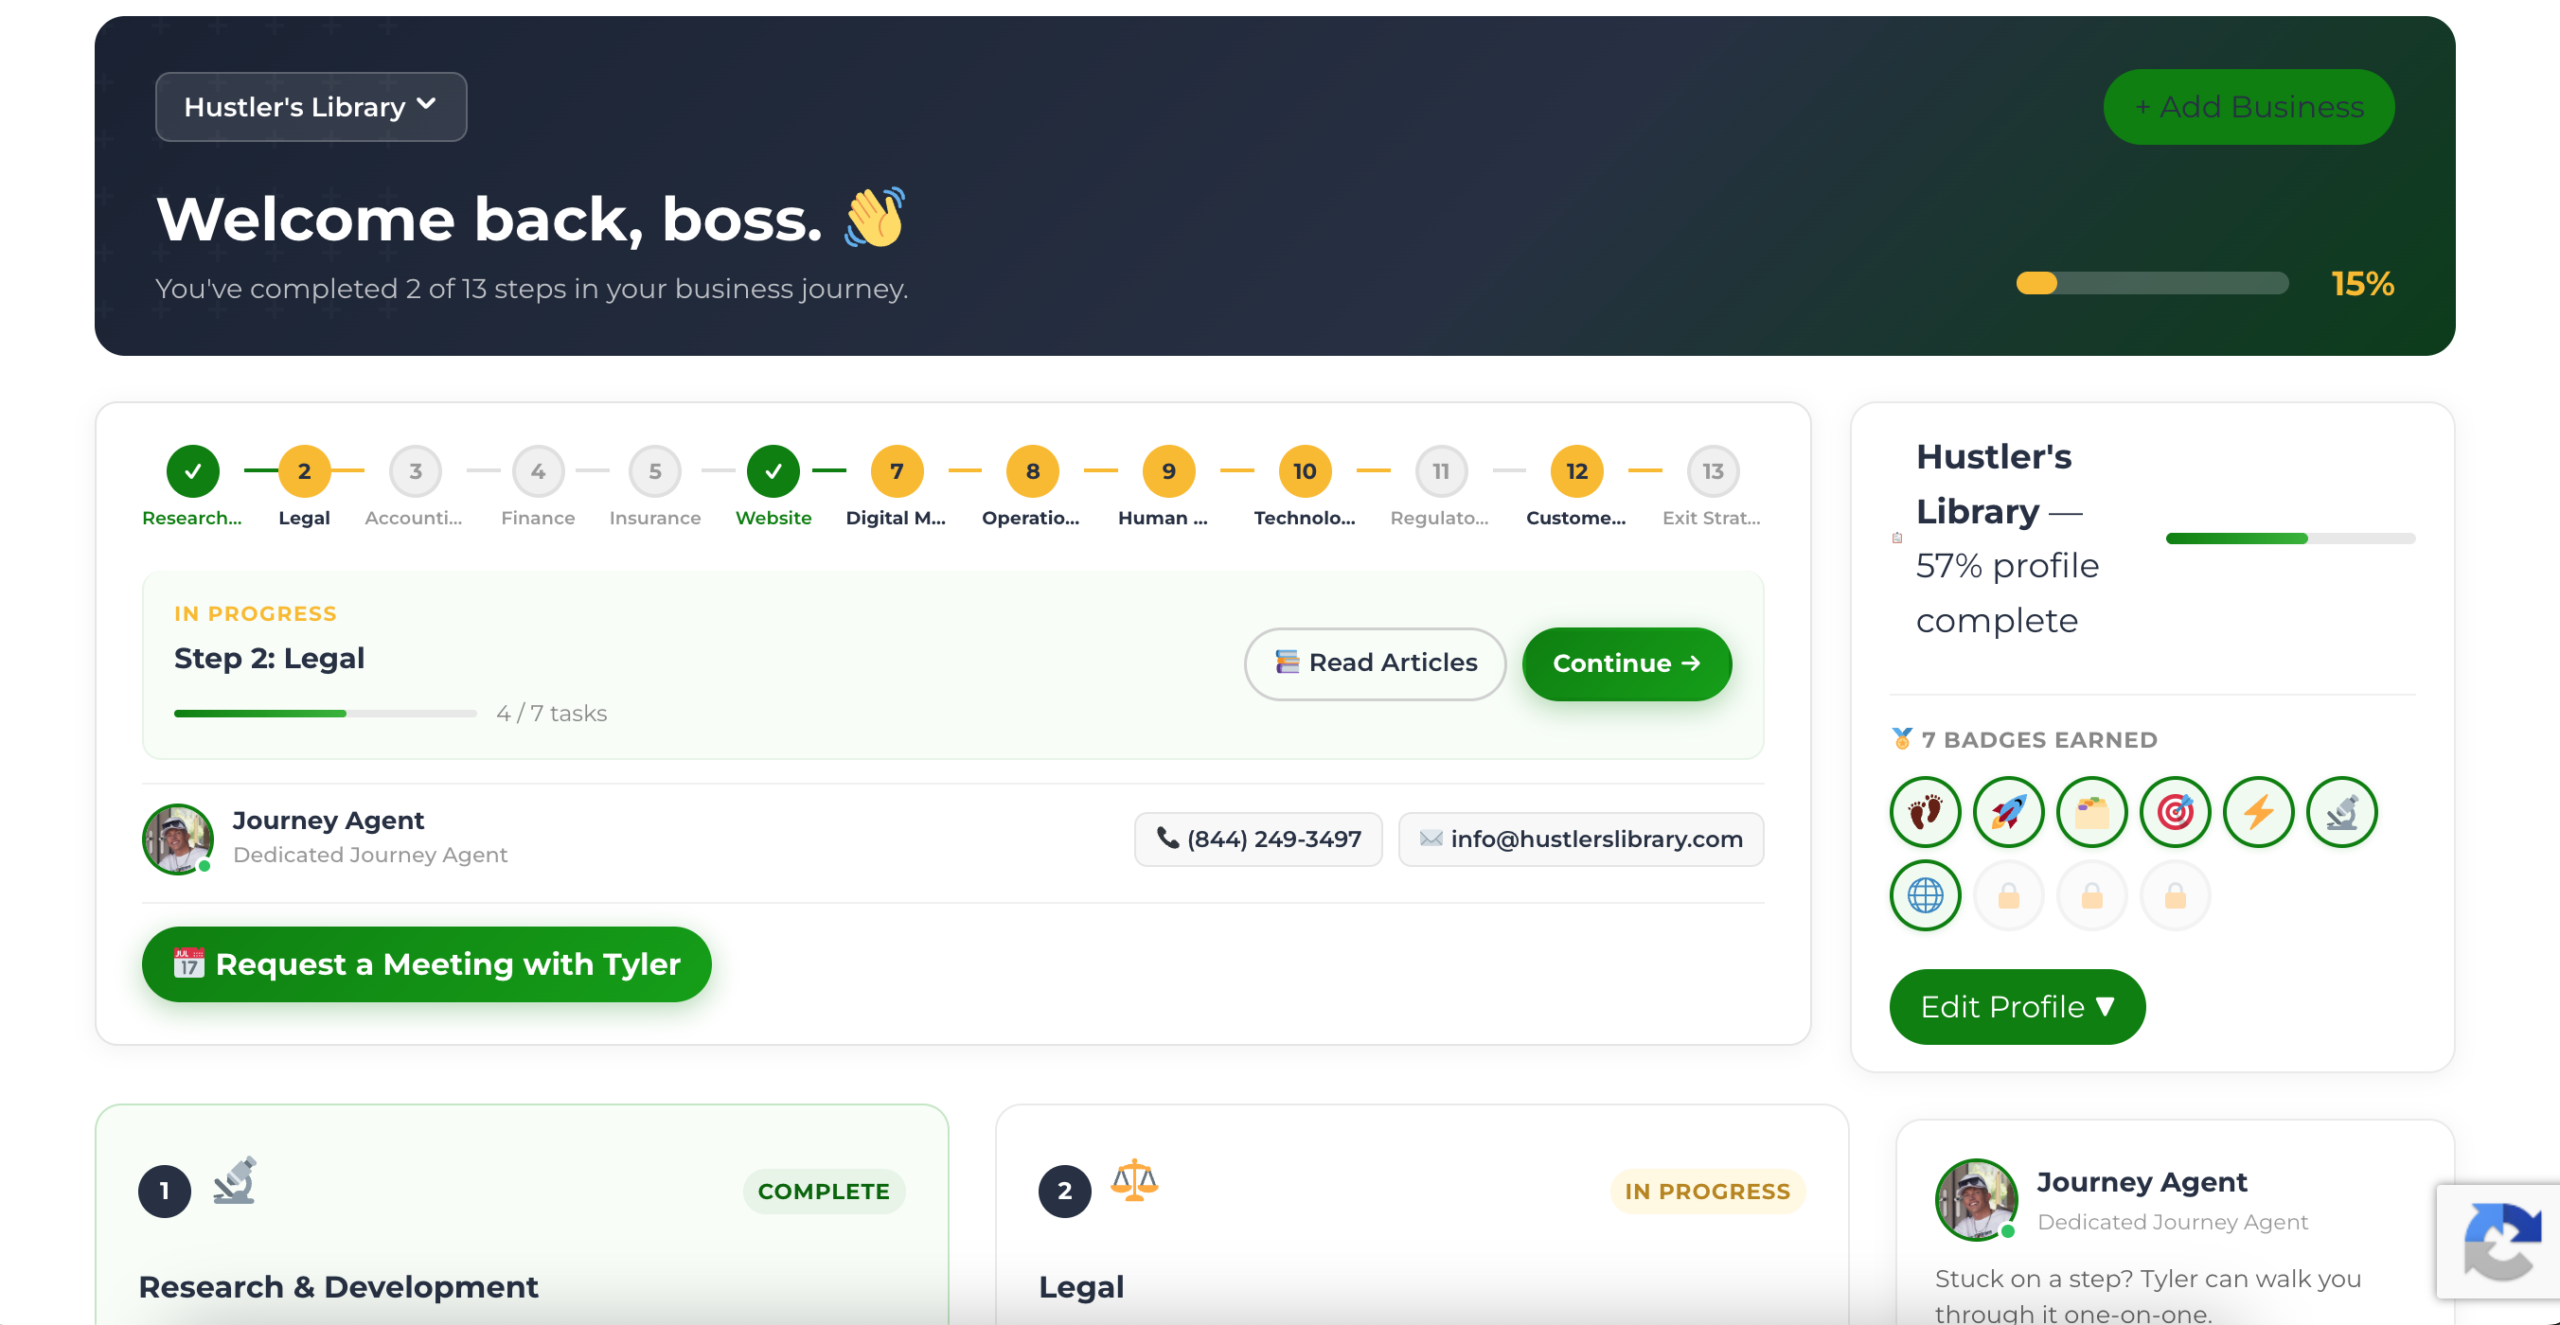
The Business Journey dashboard maps your exact position across all 13 stages. Track your progress, unlock resources for each step, and build with a framework used by thousands of founders at Hustler's Library.
No credit card required · Takes 3 minutes · Personalized to your stage