

Every small business owner has a favorite number. For some, it is revenue. For others, it is bookings, social media followers, website traffic, or the number of active clients. There is nothing wrong with tracking a key metric closely. The problem starts when one number becomes the whole story.
This is the single-metric trap: the tendency to reduce the health of an entire business to a single data point, then optimize for that number while the rest of the business drifts in directions you are not watching. It is more common than most owners admit, and it causes some of the most preventable problems in small business.
Here is what the trap looks like in practice, why it happens, and how to build a simple dashboard that gives you an honest picture instead.
Why One Number Is Never Enough
Revenue is the most common culprit. A business owner sees monthly revenue climbing and assumes the business is healthy. Meanwhile, margins are shrinking because costs are rising faster than prices. Or the team is stretched thin and service quality is slipping. Or a handful of slow-paying clients are quietly strangling cash flow.
The revenue line looks fine. Everything underneath it is quietly eroding.
The same dynamic plays out with other metrics. An owner obsessed with utilization rate pushes the team to stay fully booked, only to discover that some of those bookings are unprofitable jobs they never should have taken. An owner fixated on new client count celebrates growth while longtime, high-value clients quietly churn because they are not being attended to.
Every single metric has a blind spot. The number tells you something real, but it hides something equally real. That is why no single metric can be trusted to tell you how your business is actually doing.
The Psychology Behind the Trap
The single-metric trap is not just a data problem. It is a cognitive one. Humans are wired to simplify. When you are running a business, you are juggling an enormous number of variables, and your brain naturally searches for shortcuts. One clear number feels like clarity. It becomes the answer to the question “how are we doing?” because it is easier to hold one number in your head than twelve.
There is also a goal-setting dynamic at work. When a number becomes a target, behavior shifts to optimize for that target. This sounds like good management until you realize that optimizing for one number almost always comes at the expense of something else. Economists call this Goodhart’s Law: when a measure becomes a target, it ceases to be a good measure. The number gets better; the underlying reality does not necessarily follow.
Recognizing this pattern is the first step. The second is replacing the single number with a small set of numbers that actually represent the business.
The Five Dimensions Every Small Business Dashboard Should Cover
You do not need a complex system. You need five dimensions, each represented by one metric that is meaningful in your specific business. Here is a framework that works across industries:
1. Revenue Health
This is the top-line number most owners already track. The key is not to drop it from your dashboard but to stop letting it be the only thing on the dashboard. Track total revenue, but also watch the mix. Where is the revenue coming from? Is it concentrated in one client or one service? Is it growing in the areas with the best margins, or just in volume?
2. Profitability
Gross margin or net profit, depending on how closely you track expenses. Revenue growth without margin growth is a trap, a finding echoed in the Federal Reserve’s Small Business Credit Survey, which consistently finds that profitability pressures are among the top challenges small business owners report. A business doing $800K at 10% net profit is objectively less healthy than one doing $500K at 30% net profit. Tracking profitability alongside revenue forces you to ask whether growth is actually creating value or just creating busyness. If you have been focused on the top line, the net profit margin breakdown will often reveal exactly where value is leaking.
3. Cash Position
Many businesses that look profitable on paper run into serious trouble because they do not track cash independently. Cash is what pays the bills today. Profit is an accounting concept. Your cash balance, your accounts receivable aging, and your financial runway deserve their own line on your dashboard. How many weeks of operating expenses can you cover right now? That number is more useful in a crisis than any revenue figure. For a deeper treatment of this, the financial runway framework walks through exactly how to calculate and monitor it.
4. Customer Health
This is the metric most small business owners skip entirely, and it is often the most predictive. Customer health includes retention rate, repeat purchase rate, or client renewal rate depending on your model. It also includes a qualitative read: are your best clients growing with you, staying flat, or quietly pulling back? If you only measure new business, you will miss the slow erosion of your existing base until it becomes a revenue problem you did not see coming.
5. Operational Load
This is the one most owners track informally but rarely measure. How stressed is your team? Are you consistently behind on deliverables? Is your turnaround time creeping up? Operational load is a leading indicator of quality problems, staff turnover, and customer churn. A business that is growing fast but consistently operating at the edge of its capacity is a business building toward a breaking point. One useful proxy is your average job completion time, response time to clients, or team overtime hours. Pick the one that matters most in your context and watch it weekly.
Building the Dashboard Without Drowning in Data
The goal is not more data. The goal is better signal. A dashboard that takes you 45 minutes to update weekly will not be used. Here is how to keep it practical:
Keep it to five to seven numbers, total. One per dimension listed above, with room for one or two industry-specific additions. If your business depends heavily on lead flow, add a pipeline metric. If you have a physical location, add foot traffic or table turns. But resist the urge to add more than two extras.
Update it on the same cadence every week. Consistency matters more than sophistication. A simple spreadsheet reviewed every Monday morning is worth more than a fancy BI tool checked irregularly.
Set a threshold, not just a target. For each metric, define a threshold below which you take immediate action. Revenue below a certain weekly run rate triggers a sales push. Cash below a certain floor triggers a collections call and a pause on discretionary spending. Thresholds create automatic decision-making rules and take the ambiguity out of when to act.
Look for divergence between metrics. The most useful signal is not any individual number moving up or down. It is when two numbers move in opposite directions. Revenue up, margin down. New clients up, retention down. Bookings up, team morale down. Divergences are the early warning signs of structural problems, and you can only see them if you are tracking more than one dimension at a time.
The Common Objection (And Why It Does Not Hold Up)
The most common pushback on this kind of structured measurement is that it feels bureaucratic. “I run a small business, not a corporation.” But the owners who say this are usually already tracking one number obsessively. They are not avoiding measurement; they are just doing it poorly.
Adding four more meaningful numbers to the one you already track does not make your business bureaucratic. It makes it legible. And a business you can read clearly is a business you can actually manage. Most of the decisions that seem hard to small business owners are hard precisely because the data is incomplete. With a full picture, the right move becomes obvious far more often.
The second-order thinking framework also applies here: decisions made with complete data tend to produce better outcomes downstream, even when the immediate signal was ambiguous. Tracking more dimensions does not slow you down. It makes the decisions you do make more durable.
The Bottom Line
Your business is not one number. It is a system of interdependent parts, and each part has its own way of telling you it needs attention. The single-metric trap is seductive because simplicity feels like clarity. But when your favorite number is going up while something essential is quietly going wrong, you want to know sooner rather than later.
Build a five-number dashboard. Update it every week. Let it tell you the whole story.
For more tools and frameworks built for small business owners, join the free Hustler’s Library community and get access to guides, templates, and resources that help you run a smarter operation.
Ready to Know Where You Stand?
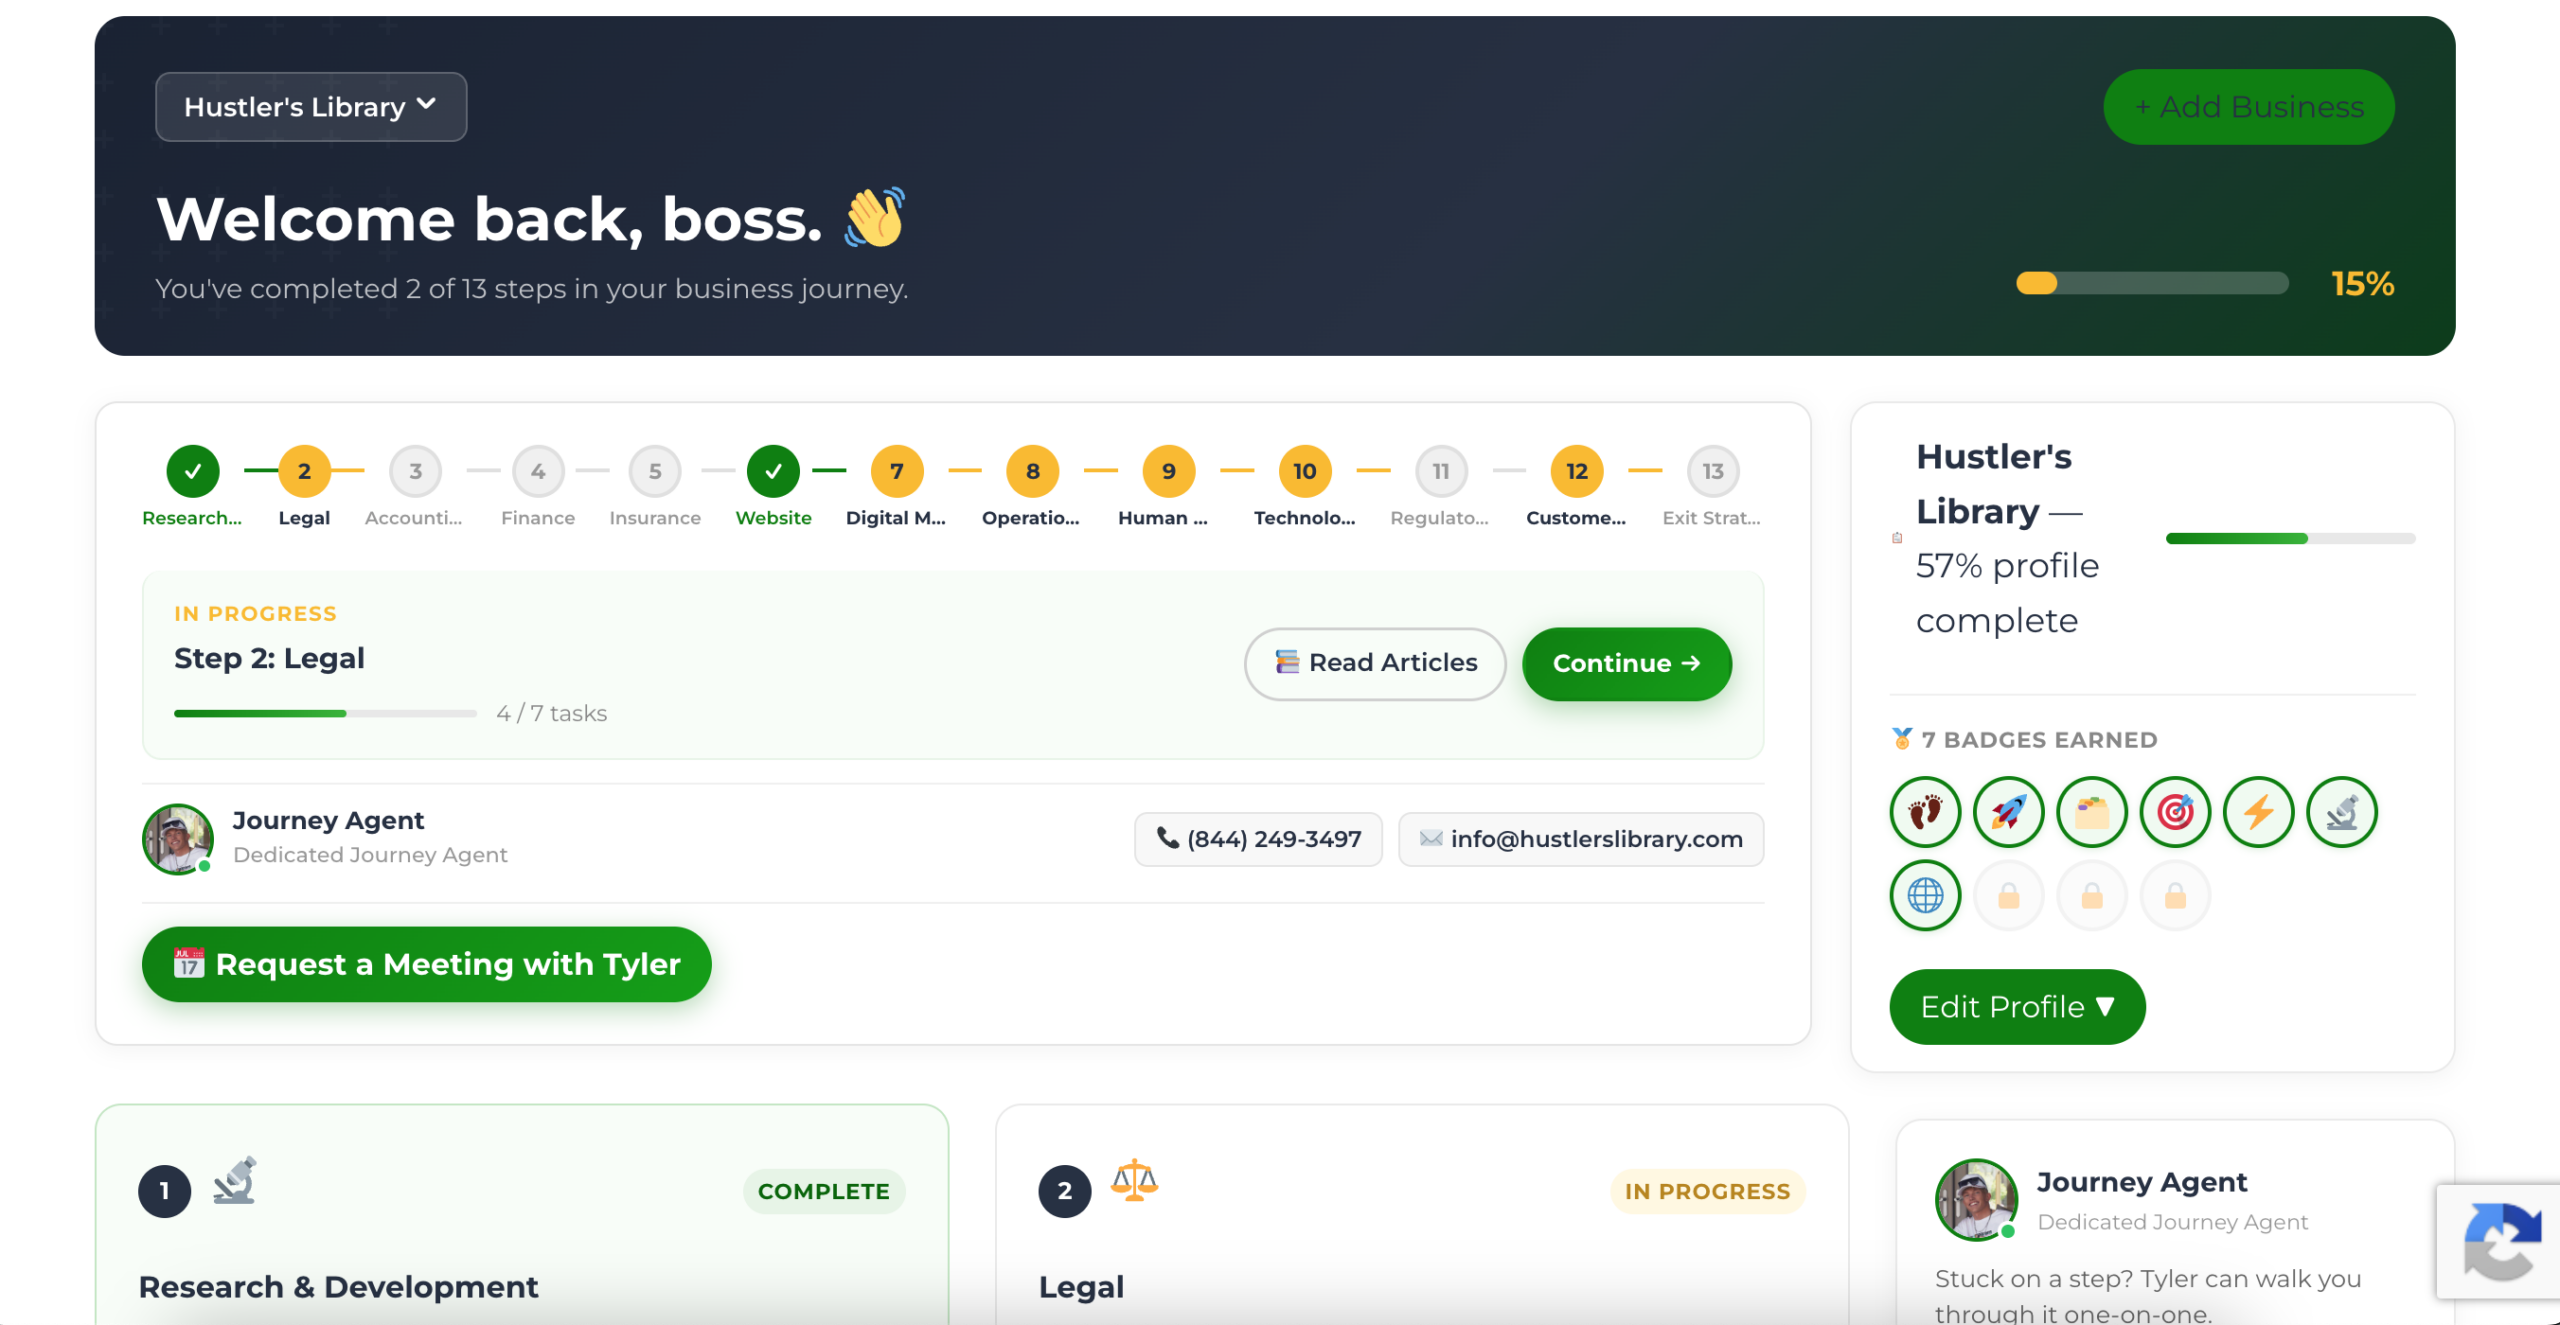
The Business Journey dashboard maps your exact position across all 13 stages. Track your progress, unlock resources for each step, and build with a framework used by thousands of founders at Hustler's Library.
No credit card required · Takes 3 minutes · Personalized to your stage