

Every small business owner tracks revenue. Most track expenses. Some track profit. But almost nobody tracks the one ratio that cuts through all the noise and tells you, in a single number, whether your business is actually getting more efficient as it grows.
That number is revenue per employee.
It’s simple to calculate, brutally honest, and almost universally ignored by small business owners until they’re in trouble. Here’s why it matters, what it actually measures, and how to use it to make smarter decisions about hiring, growth, and where your real bottlenecks are.
What Revenue Per Employee Actually Measures
Revenue per employee (RPE) is exactly what it sounds like: your total annual revenue divided by the number of people on your payroll (including yourself and any part-time staff, converted to full-time equivalents).
If your business does $800,000 in revenue and you have four full-time employees, your RPE is $200,000.
What makes this ratio so useful is what it reveals underneath the surface. RPE is really a measure of how productively your business converts human effort into output. A rising RPE means your team is getting more leverage. A falling RPE means you’re adding people faster than you’re adding value. And a flat RPE while your competitors’ is climbing means you’re falling behind, even if your revenue looks fine on paper.
This is why RPE shows up in almost every serious business valuation and why buyers, investors, and acquirers scrutinize it closely. It’s one of the fastest ways to assess whether a business is well-run or just well-staffed.
Industry Benchmarks Worth Knowing
RPE varies wildly by industry, so context matters. A rough guide:
- Professional services (consulting, law, accounting): $150,000 to $300,000+ per employee
- Technology and software: $250,000 to $500,000+ per employee
- Retail: $100,000 to $200,000 per employee
- Restaurants and food service: $50,000 to $100,000 per employee
- Construction and trades: $150,000 to $250,000 per employee
- Marketing and creative agencies: $120,000 to $200,000 per employee
If your RPE is significantly below your industry average, something is off; either you’re overstaffed, underpriced, or both. If your RPE is well above average, you’re either highly efficient or you’re understaffed and burning people out. Both extremes matter.
The goal isn’t just to maximize RPE. It’s to maintain a healthy RPE while staying sustainable. You want efficiency without burning out your team or sacrificing quality.
The Trap Every Growing Business Falls Into
Here’s where most small business owners run into trouble. They hit a growth milestone and immediately think the answer is to hire more people. Revenue is climbing. There’s more work than the current team can handle. It feels obvious.
But hiring almost always drops your RPE before it improves it. Every new employee comes with onboarding time, training costs, management overhead, and a learning curve. In the short term, adding headcount is almost guaranteed to reduce efficiency. The question is whether the long-term productivity gain justifies the temporary drop.
The businesses that get this wrong hire too fast, too early, and then find themselves with a bloated payroll and a shrinking RPE. Suddenly they’re generating more revenue than ever and somehow making less per dollar of revenue than they used to. That’s the growth trap, and RPE is one of the clearest early warning signals that you’re heading toward it.
Before you hire, always ask: can I solve this capacity problem with a process, a tool, or a system instead of a person? If the answer is yes, solve it that way first. Use workflow automation and better systems before adding headcount. Your RPE will thank you.
How to Actually Improve Your Revenue Per Employee
There are only two ways to improve RPE: increase revenue without adding proportional headcount, or reduce headcount while maintaining revenue. In practice, the first option is almost always the right one. Here’s how to approach it:
Raise your prices
This is the fastest lever. If you can charge more for the same output, your RPE improves immediately with no operational changes required. Many small business owners resist this because they fear losing clients, but underpricing is often the root cause of low RPE. If your prices are where they should be, your team’s output is worth more.
Eliminate low-revenue, high-effort work
Not all revenue is created equal. Some clients, projects, or product lines require far more labor per dollar than others. Identifying and pruning these is one of the highest-leverage moves a business owner can make. Use a customer profitability analysis to find which parts of your business are dragging your RPE down.
Invest in tools that multiply output
Software, automation, AI-assisted workflows, and better project management systems all let your existing team produce more. Every dollar invested in tools that increase per-person output is a direct RPE improvement. This is where small businesses often dramatically outperform their larger competitors, because the right tools can let a team of five produce what used to require a team of twelve.
Hire for leverage, not just capacity
When you do hire, think carefully about which roles unlock the most additional revenue. A great salesperson who brings in $400,000 in new revenue dramatically improves RPE. An additional customer service rep who handles the same volume as the last one adds cost without adding proportional revenue. Not all hires are equal.
RPE as a Decision-Making Tool
One of the most practical uses of RPE is as a filter for major business decisions. Before any significant investment, ask yourself how it affects your RPE over the next 12 to 24 months.
Opening a second location? Model out how many additional employees you’ll need and whether the projected new revenue will sustain or improve your current RPE. Adding a new service line? Do the same math. Considering an acquisition? RPE should be one of the first numbers you calculate for the target business.
The financial ratios that drive smart business decisions aren’t complicated; they’re just consistently ignored. RPE is no different. The business owners who track it quarterly, benchmark it against their industry, and make hiring decisions with it in mind tend to build leaner, more profitable operations than those who don’t.
According to the Small Business Administration, monitoring key financial metrics is one of the most consistent differentiators between businesses that scale successfully and those that plateau. RPE belongs on that short list.
What a Healthy RPE Trend Looks Like
The number itself matters less than the trend. A business with a $150,000 RPE that’s been climbing for three consecutive years is in a much stronger position than a business with a $200,000 RPE that’s been declining.
Track your RPE quarterly. Set a benchmark target based on your industry. When it drops, investigate before you assume more hiring is the answer. When it rises, understand why so you can replicate it. Over time, this single metric will give you more useful insight into the health of your operation than almost any other number you track.
The goal isn’t to squeeze every last dollar out of a lean team. It’s to build a business where the people you have are well-compensated, well-utilized, and genuinely driving growth rather than just filling seats. RPE keeps you honest about whether you’re doing that.
Start Tracking It Now
Pull last year’s total revenue. Count your full-time-equivalent headcount. Divide the first by the second. Look up your industry benchmark. That’s all it takes to get your first data point.
Then decide: is your current ratio something to be proud of, or something to fix? And what’s the one change, whether it’s raising prices, cutting a low-margin service, or investing in better tools, that would move that number most in the next 90 days?
The best-run small businesses aren’t necessarily the biggest or the busiest. They’re the ones that produce the most value per person. Revenue per employee tells you exactly where you stand.
Want more strategies for building a leaner, more profitable business? Join Hustler’s Library for free and get the insights that actually move the needle.
Ready to Know Where You Stand?
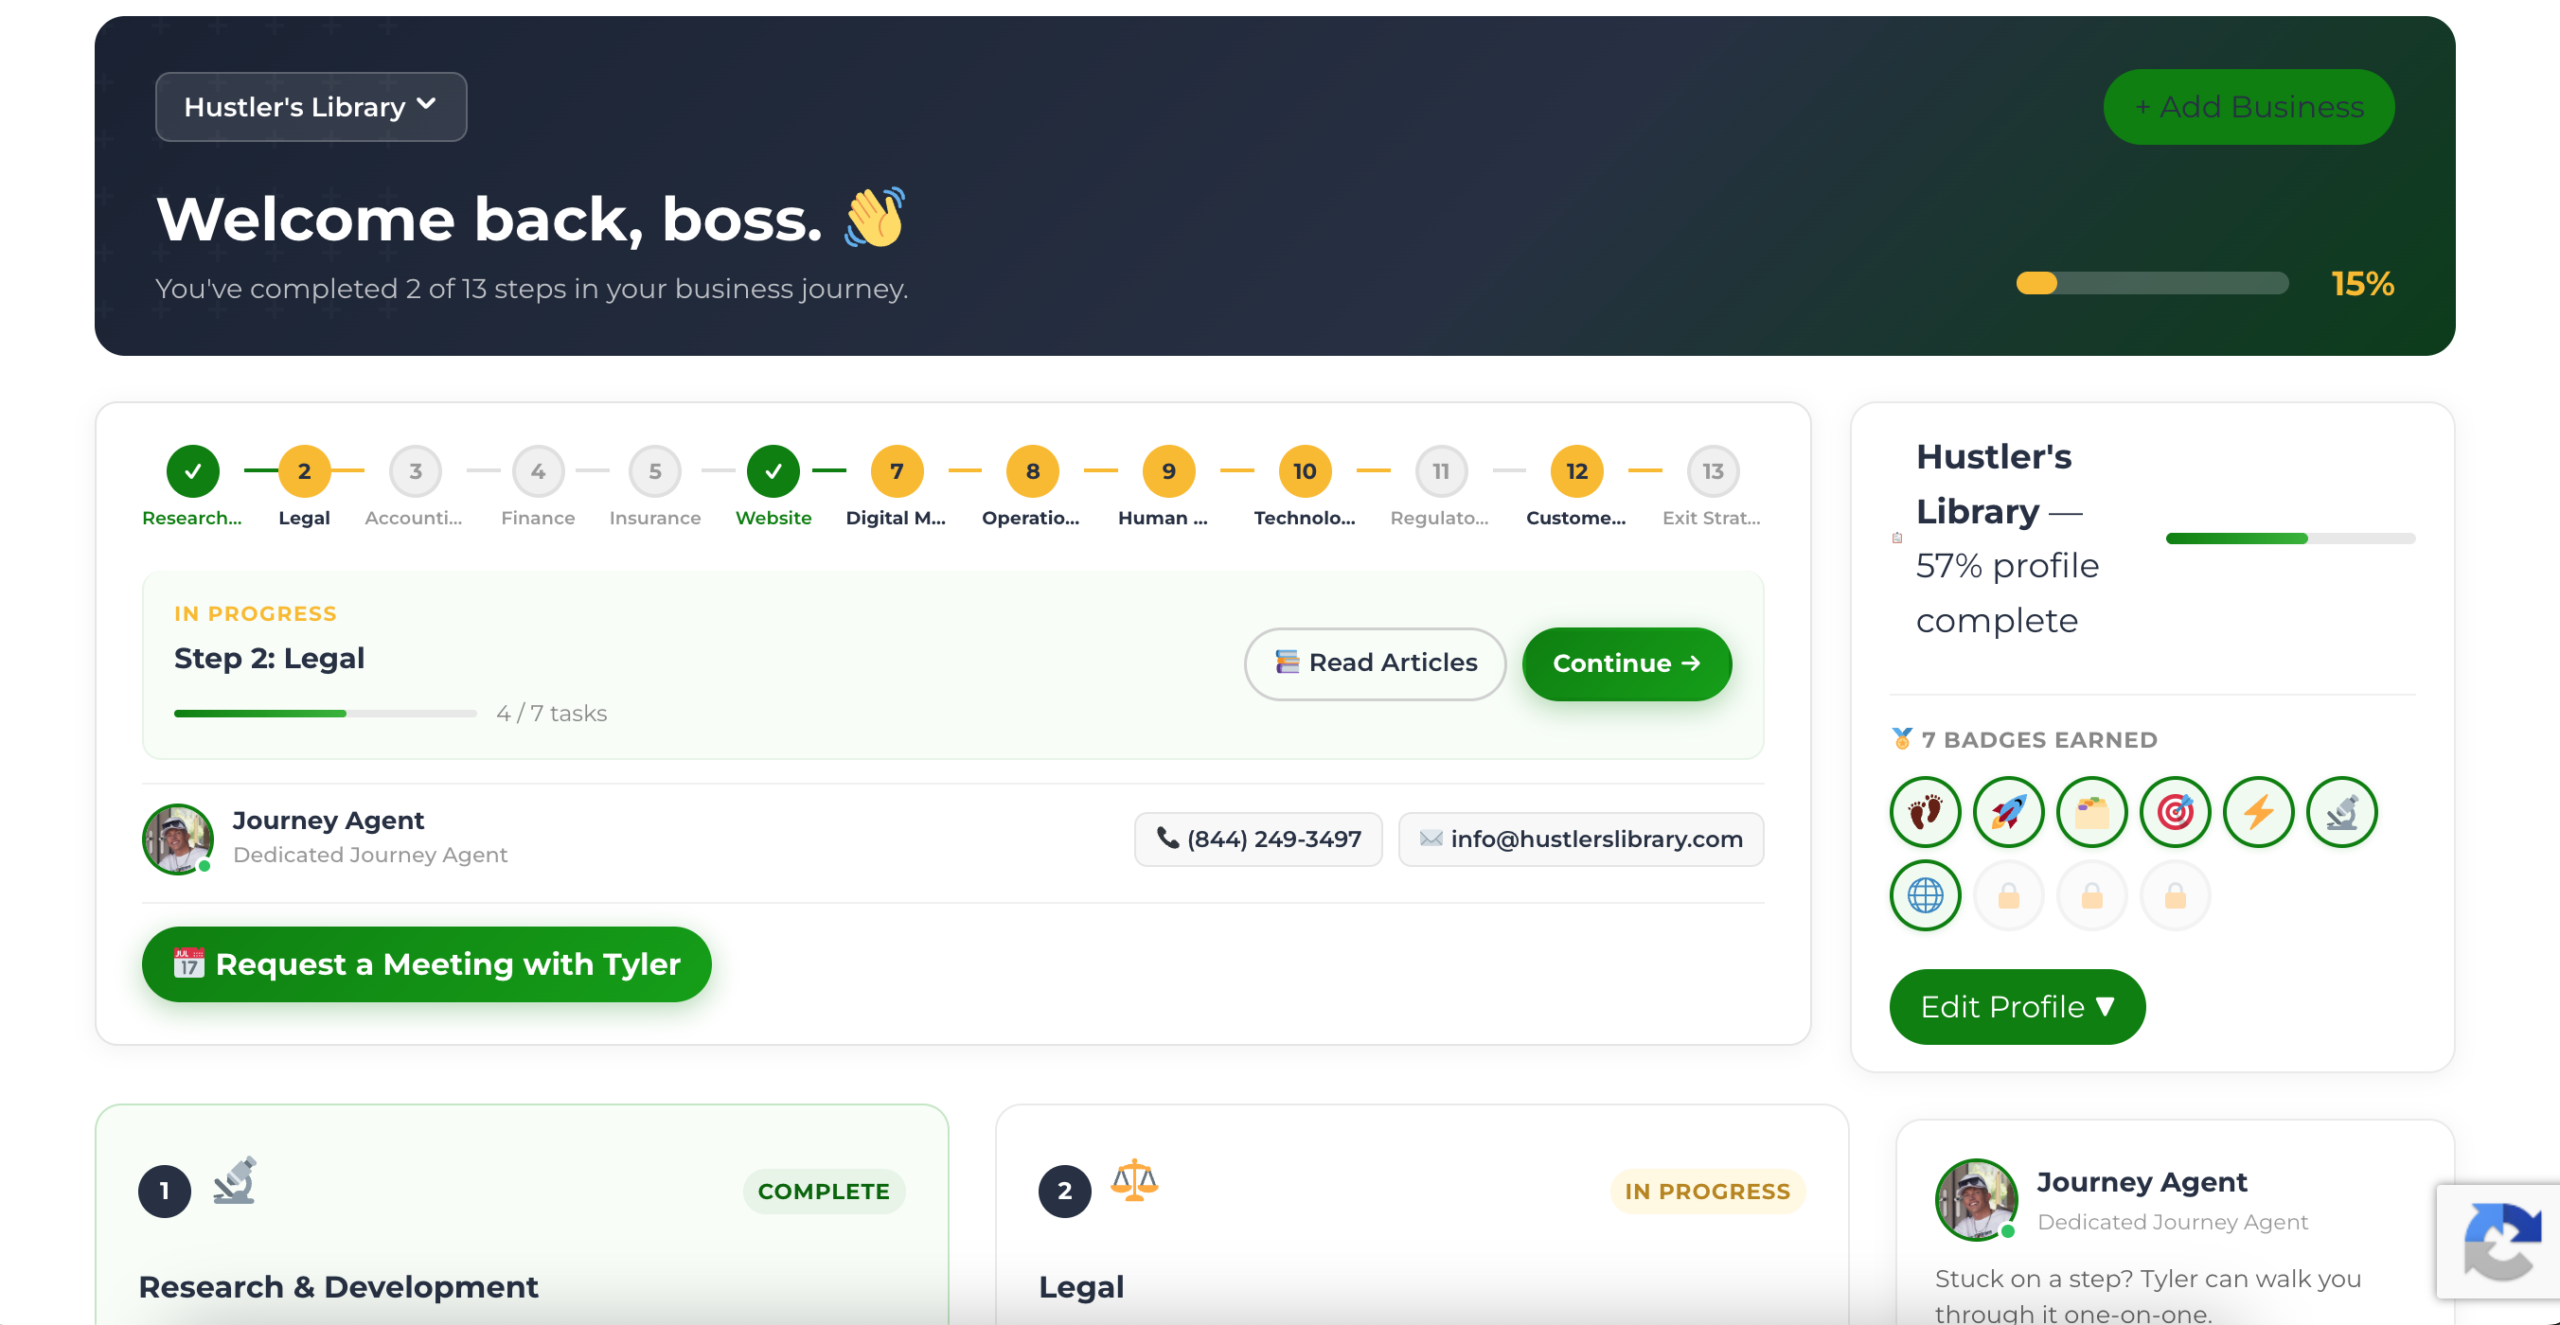
The Business Journey dashboard maps your exact position across all 13 stages. Track your progress, unlock resources for each step, and build with a framework used by thousands of founders at Hustler's Library.
No credit card required · Takes 3 minutes · Personalized to your stage